Fibonacci Grid
 By LuxAlgoMar 28, 2022
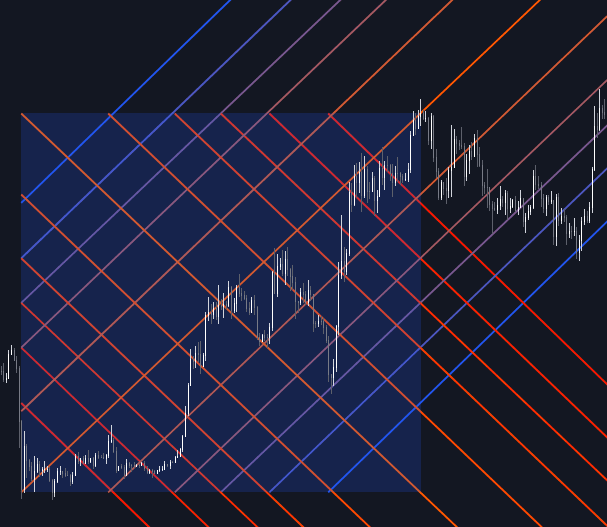
Fibonacci Grid projects support and resistance diagonally instead of horizontally. Every line is drawn at a precise 45-degree angle and positioned using Fibonacci ratios applied to the highest and lowest prices of a lookback window (or, for uniform structure, switched to equidistant spacing). The result is a lattice where price interacts with sloped levels whose values evolve bar by bar rather than sitting flat.
How to Trade the Fibonacci Grid?
- Individual diagonals: each line is a candidate support or resistance level; watch for price riding along a diagonal or rejecting it outright.
- Converging lines form channels: price tends to travel inside these corridors until a breakout, and the break itself can flag a shift in market conditions.
- Distance from the main diagonals: moves that stretch far from the orange main diagonals typically gravitate back toward the narrower channels, a built-in mean-reversion cue.
- Ratio versus equidistant spacing: Fibonacci spacing tightens the channels as they extend from the center of the lookback area; equidistant spacing keeps every gap uniform.
Fibonacci Grid Settings
- Length: the lookback used to find the maximum and minimum prices that frame the grid.
- Resolution: grid density when Fibonacci spacing is off. Higher values draw more lines.
- Use Fibonacci Ratios: positions the lines at six specific Fibonacci ratios instead of equal intervals.
Frequently Asked Questions
Free indicator
Get free access to this indicator on the platforms below.
TradingView
NinjaTrader
MetaTrader 4/5

Original indicatorBuilt in-house by LuxAlgo
The Library is free. Quant makes it yours.
Pull any concept or indicator into Quant: rebuild it, retune it, or turn it into a backtested strategy of your own.