Follow-through Day
 By LuxAlgoOct 9, 2026
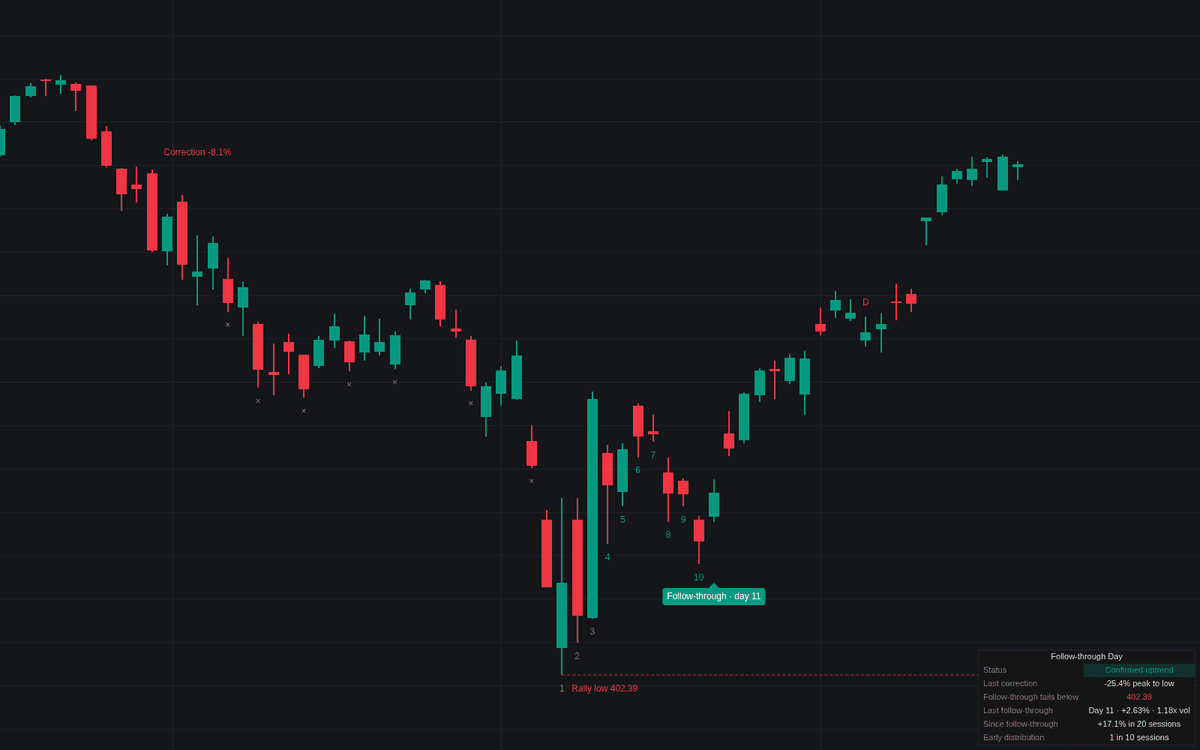

The Follow-through Day indicator is a systematic tool designed to identify potential trend reversals following periods of market correction. By tracking rally attempts on major indices, the indicator helps traders detect the pivotal session where institutional buying confirms a new uptrend. This automated approach eliminates guesswork by applying specific volume and price criteria to pinpoint high-probability market entries, ultimately providing users with a clearer view of the current market cycle and overall health.
How to Trade the Follow-through Day?
To trade effectively with this indicator, first monitor the market state to identify when an index has entered a correction phase. Once the index shows signs of life, the indicator begins counting "rally attempt" days. Your primary goal is to wait for a Follow-through Day, which typically occurs on Day 4 or later of the rally. A valid follow-through is characterized by a significant percentage gain on higher volume, signaling that institutional investors are supporting the upward move.
Once a follow-through is confirmed, the focus shifts to trade management. The indicator provides a "failure level" based on the rally attempt low. If the index undercuts this price level, the follow-through is considered failed, and it may be prudent to reduce exposure or move to cash. Additionally, pay close attention to the dashboard for "early distribution" warnings. If multiple distribution days occur shortly after a follow-through, the trend is under pressure, suggesting that the recent breakout may lack the necessary momentum to sustain long-term gains.
Follow-through Day Settings
Correction
- Correction Depth %: Sets the percentage drop from the highest close required to trigger a correction state.
Rally Attempt
- Attempt Fails Below: Determines if the rally attempt count resets when the price drops below the Day 1 low or the correction low itself.
- Day 1 on Upper-Half Reversal: When enabled, allows a session that closes in the upper half of its range after hitting a new low to qualify as Day 1.
Follow-through Rules
- Earliest Day: Sets the minimum day count for a follow-through to be valid.
- Latest Day: An optional cap on the rally day count. 0 means no limit.
- Minimum Gain %: The required close to close percentage gain on the follow-through day.
After the Follow-through
- Failure Watch (sessions): The period following a follow-through where an undercut of the low marks a failure.
- Early Distribution Window: The number of sessions after the follow-through used to monitor for stacking distribution days.
- Early Distribution Warning At: The number of distribution days required to flag the trend as being under pressure.
Dashboard
- Show Dashboard: Toggles the on-chart status panel.
- Position / Size: Controls the placement and scale of the dashboard.
Style
- Number Rally Days: Toggles the numeric labels on each session of a live rally attempt.
- Colors: Customizable color settings for follow-through events, corrections, and warnings.
Frequently Asked Questions
Free on Vela
Run it on Vela. Go further with a paid plan.
- Up to 500 strategy alerts, with webhook automation
- Up to 10× the chart history of Free
- Orderflow lookback up to full history
- Up to 100,000 monthly credits for Quant to customize it
- Futures data alongside crypto, stocks, forex and commodities

Run it on Vela. Make it yours with Quant.
Open this indicator free on Vela, our next-generation charting platform. Then ask Quant, our coding agent built into Vela, to retune it or turn it into a backtested strategy of your own.