Follow-through Day
Follow-through Day, also known as FTD, follow-through, IBD follow-through day, is a Breadth, Sentiment & External Data concept. The Library holds 1 implementation, a working definition you can pull into Quant.
Top Follow-through Day indicator
The top custom implementation, built on the original standard Follow-through Day formula.
1 total
The Follow-through Day implementation below can become a backtested trading strategy — describe your rules and Quant writes the code.
What is a follow-through day?
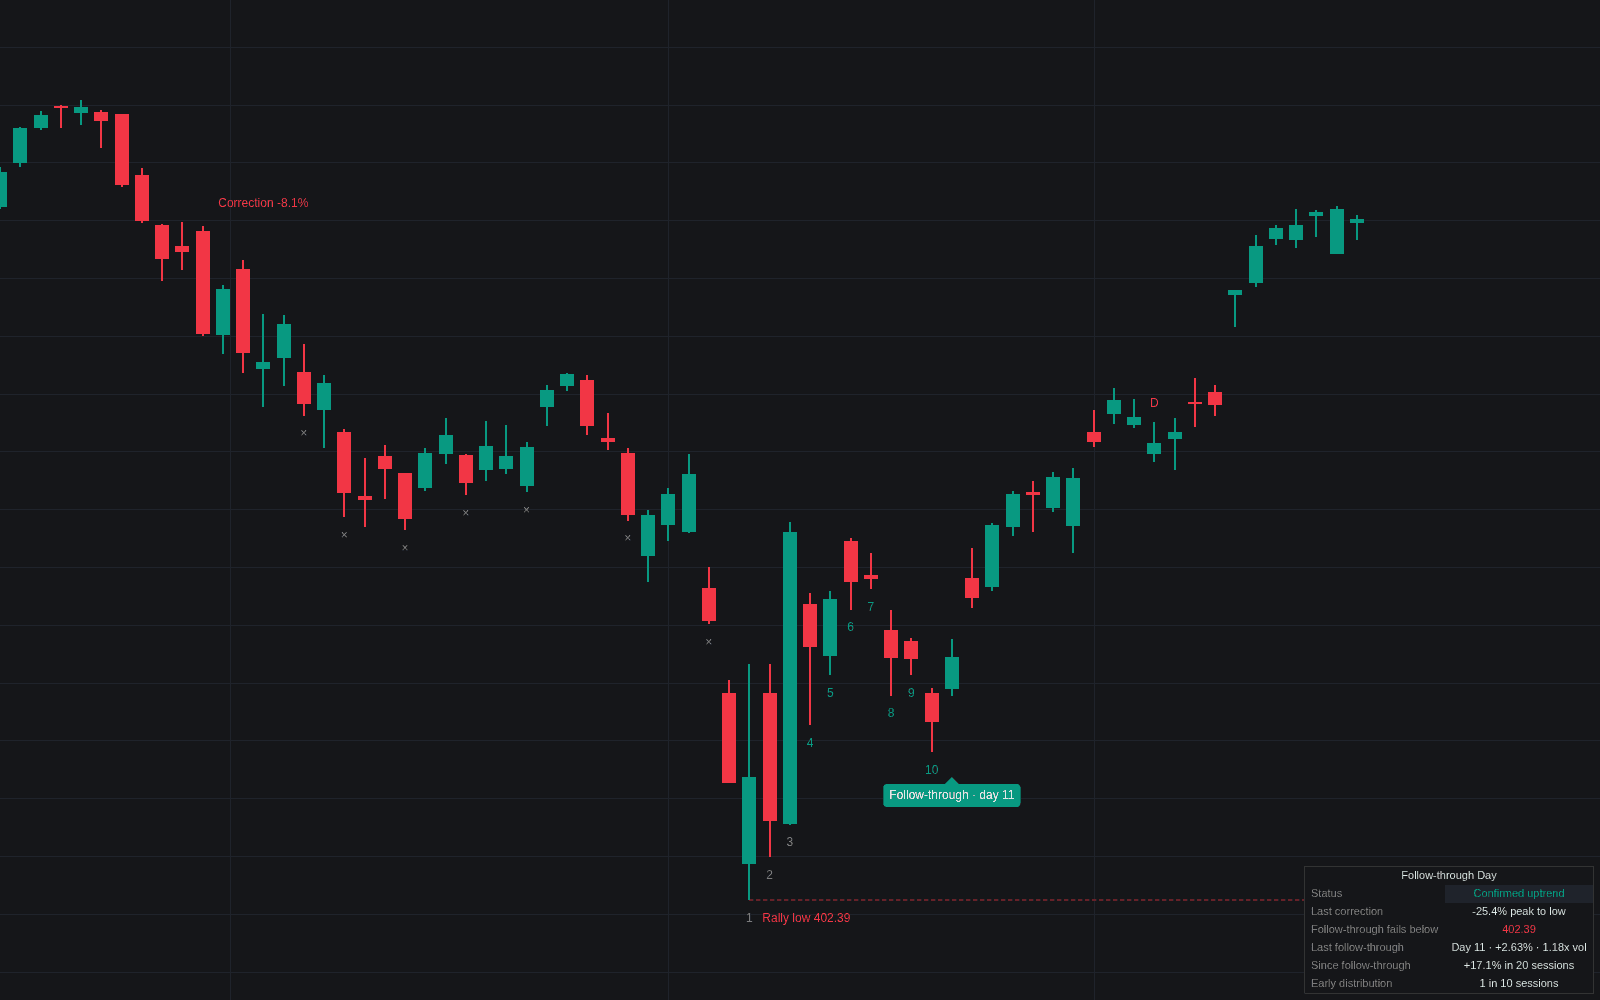
A follow-through day is William O'Neil's confirmation that a market correction may have ended: on the fourth day or later of a rally attempt, a major index closes up strongly on higher volume than the session before. It is the bullish half of the market-direction rules in O'Neil's How to Make Money in Stocks, applied daily by Investor's Business Daily, and the counterpart to the distribution day count.
The counting is precise. Day 1 of a rally attempt is the first session after a new correction low in which the index closes higher; IBD also accepts a day that undercuts the low and then closes in the upper half of its range. The attempt stays alive while the index holds above Day 1's low; an undercut restarts the count. From Day 4 onward, a gain of at least a set percentage in the Nasdaq Composite or the S&P 500, on volume above the prior session, is the follow-through; one index is enough. O'Neil found the strongest follow-throughs on days 4 to 7.
The minimum gain has moved over the decades. O'Neil's original rule used 1%, and his 2002 edition says he had since raised it; IBD was applying 1.7% by the mid-2000s, arguing markets had grown more volatile, and recent descriptions of IBD's rule commonly give about 1.25%. The volume test has not changed: higher than the day before, not necessarily above average.
IBD's position is that not every follow-through leads to a new uptrend, but no major rally has begun without one. Independent tests are mixed: Rob Hanna's 2008 Quantifiable Edges studies of S&P 500 follow-throughs since 1971 found success rates near a coin flip under his definitions, short of the 70 to 80 percent IBD had cited, and found the 1.7% bar missed or came late to several rallies the 1% version caught. Treat it as permission to start buying leaders, not as a buy signal for the index.
How it's calculated
Rally-attempt counting and the follow-through test on one index's daily data.
Run the test on the Nasdaq Composite and the S&P 500 separately; when Alive_t drops to 0, a new Day 1 is sought.
How traders use it
- Re-entry permission: O'Neil-style traders wait for a follow-through before buying, then add exposure only as leading stocks break out of sound bases and hold.
- Gradual exposure: positions are built in steps after the signal, so a failed follow-through costs a small test position, not a full book.
- Failure monitoring: an undercut of the rally attempt's low, or distribution days stacking up soon after the signal, puts the market back in correction.
Follow-through day vs related signals
Distribution Day Count: The bearish counterpart: high-volume down days counted over 25 sessions. A follow-through is a single event confirming a new uptrend; distribution days accumulate to question an existing one.
Breadth Thrusts: A thrust measures how fast participation swings from washed out to near-unanimous across many stocks. A follow-through uses only the index's change and volume, so it can fire on a narrow rally.
O'Neil Base Analysis: Base analysis times entries in individual stocks. The follow-through day decides whether the market environment permits those entries at all; O'Neil's method uses the two together.
Concept family
Breadth, Sentiment & External Data
56 concepts mapped · 56 in the Library
Follow-through Day FAQ
Turn Follow-through Day into a trading strategy.
Take the implementation from this page into Quant, then build on it, backtest it on real data, and keep refining it in conversation.