GMMA / MA Ribbon
 By LuxAlgoApr 13, 2020
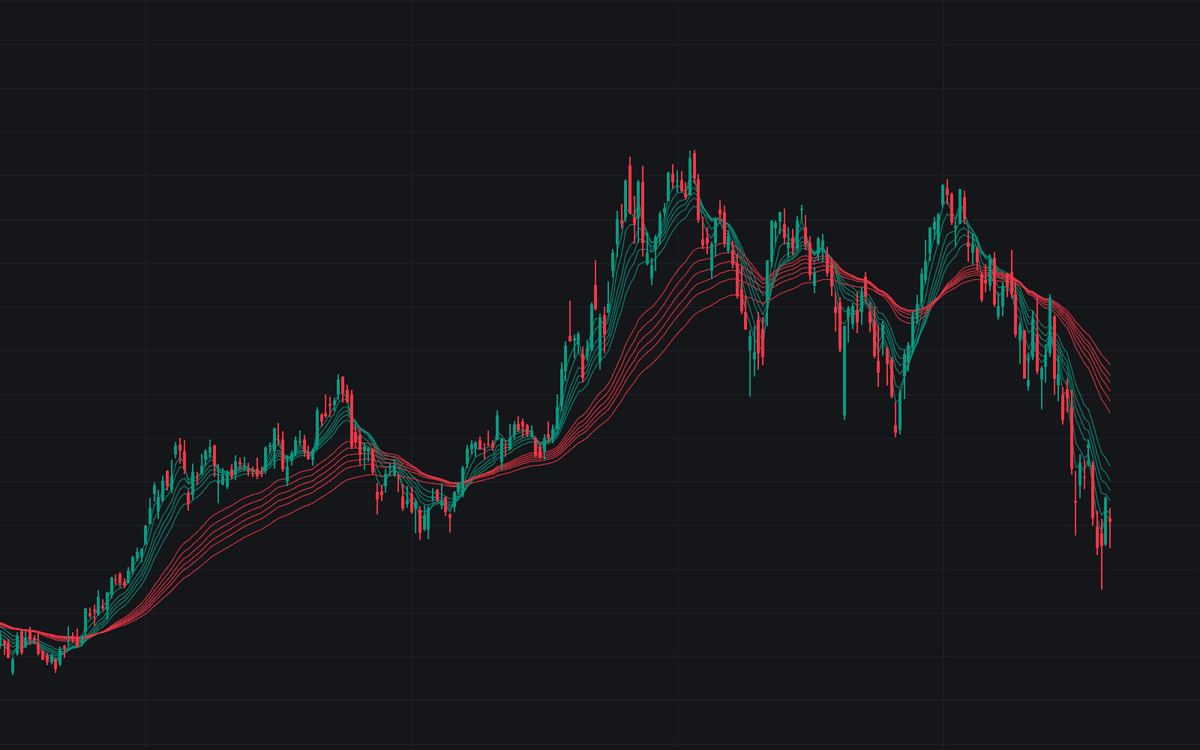

The GMMA / MA Ribbon plots Daryl Guppy's Multiple Moving Average as a ribbon of twelve exponential moving averages in two colored groups: a short-term set with lengths 3, 5, 8, 10, 12, and 15, and a long-term set with lengths 30, 35, 40, 45, 50, and 60. The premise is behavioral (the short group tracks fast-trading money, the long group the slower money underwriting the trend) and the information lives in how the two groups behave, not in any single line.
This is the standard Guppy construction using the classic length sets, each group drawn in its own color directly on the price chart.
How to Trade the GMMA / MA Ribbon?
- Both groups wide and parallel: a trend in good health, slower money committed, faster money following.
- Short group folding back into a well-spread long group: a pullback; the classic continuation entry is the short group bouncing there and fanning out again.
- Long group tightening: conviction behind the trend is thinning. Treat it as fragile.
- Both groups intertwined: a range. GMMA readings carry the least weight; the textbook response is standing aside.
- One group crossing fully through the other: the late, structural confirmation that the trend has changed; the build averages each group and fires Bullish and Bearish Ribbon Cross alerts when the short-term average crosses the long-term.
Expansion confirms and compression warns; the most common GMMA mistake is forcing trades in the intertwined state, when the ribbon shows no edge.
GMMA / MA Ribbon Settings
- Short-Term EMAs / Long-Term EMAs: the build's two inputs set each group's color. Six short-term EMAs tracking trader activity, six long-term EMAs tracking investor activity. The twelve lengths are fixed to Guppy's published sets by design, so charts read identically across users.
Frequently Asked Questions

The Library is free. Quant makes it yours.
Pull any concept or indicator into Quant: rebuild it, retune it, or turn it into a backtested strategy of your own.