Concept
Guppy GMMA
Guppy GMMA is a Trend concept. The Library holds 1 implementation, a working definition you can pull into Quant.
trader vs investor bands
The standard Guppy GMMA indicator
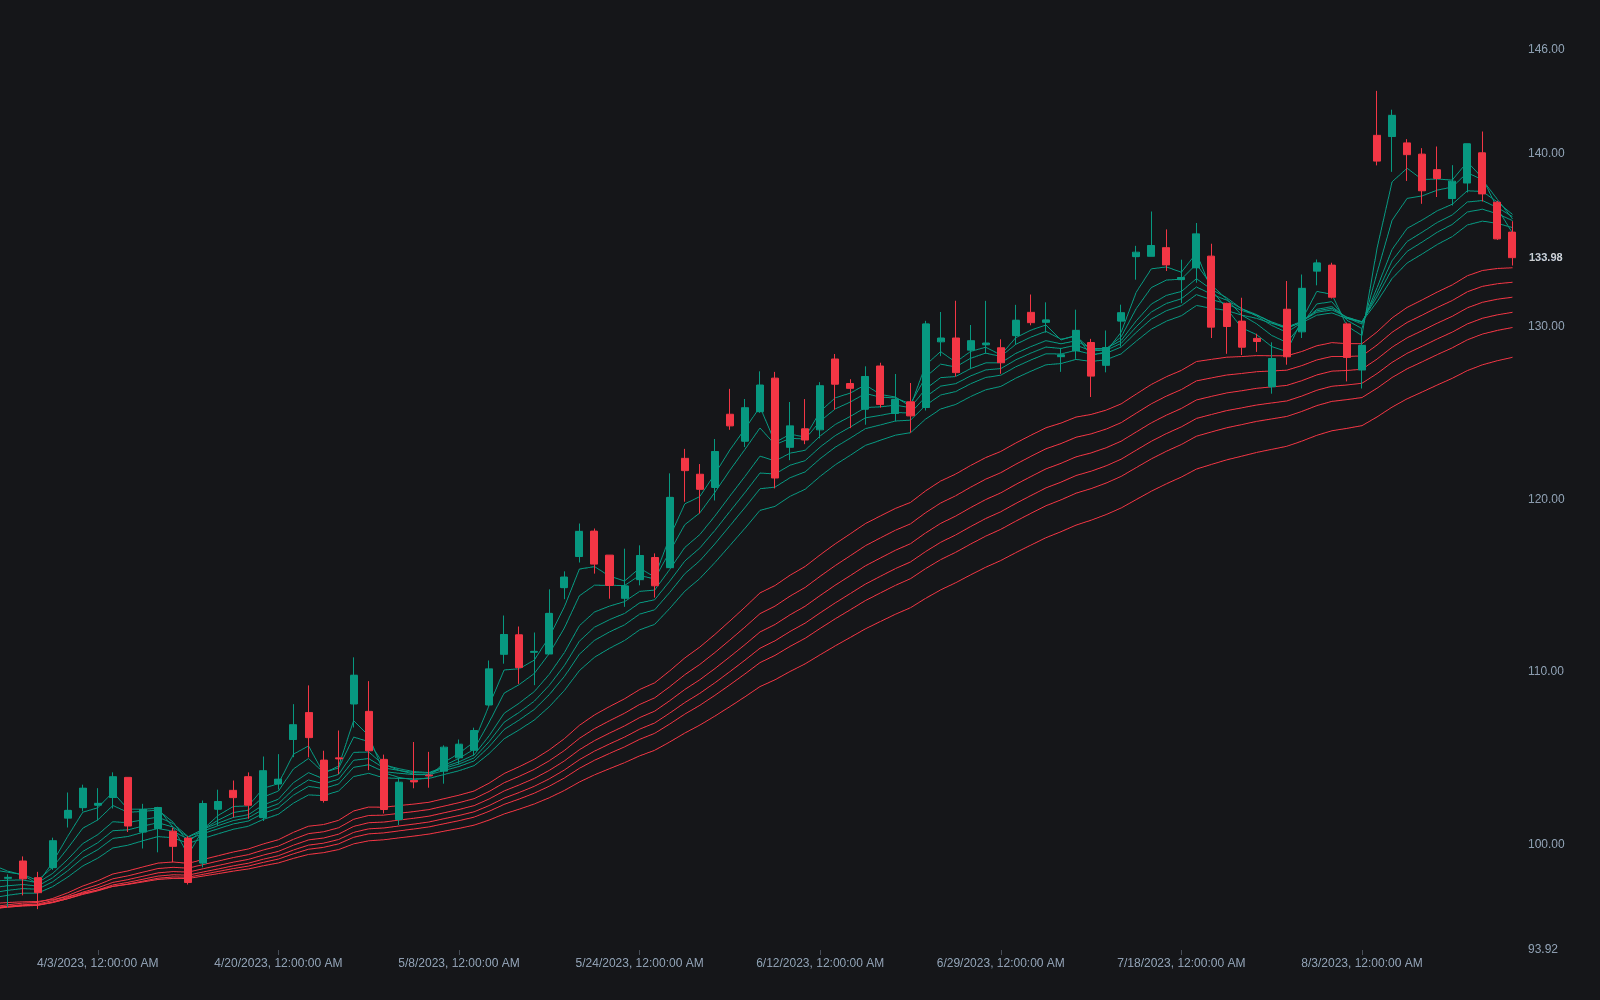
Guppy GMMA exactly as classically defined: the faithful reference build of the original formula, free to run in Quant.
What is the Guppy GMMA?
The Guppy Multiple Moving Average, developed by Australian trader Daryl Guppy, plots two groups of six EMAs: a short-term group (traditionally 3, 5, 8, 10, 12 and 15 periods) standing in for traders, and a long-term group (30, 35, 40, 45, 50 and 60) standing in for longer-horizon investors. Twelve lines print on the chart, but the analysis is about the behavior of the two groups, not any individual average.
Guppy developed and taught the technique from the 1990s onward across his trading books and columns, and its premise is behavioral rather than mathematical: the short cohort approximates fast money's consensus, the long cohort approximates committed money's, and the distance and interplay between them display agreement or conflict between the two populations. The exponential weighting keeps each cohort responsive to its own horizon.
The reading is relational. Wide, orderly separation within the long-term group is taken as investor commitment behind the trend; compression within either group signals agreement dissolving and a possible regime change; and the short-term group repeatedly pulling away from, then returning to, a well-separated long-term group maps the rhythm of traders probing while investors absorb. A full crossover of one group through the other is the slow, structural trend-change signal.
The taxonomy of states is small enough to learn quickly. Both groups separated and parallel is the healthy trend; short group compressing into a still-separated long group is the pullback under way; both groups compressed and braided is the range, where GMMA reads are explicitly unreliable; and the long group compressing while the short group whips through it is the regime change in progress. Most GMMA mistakes are range trades taken in the third state, which the tool itself was flagging.
How to read the GMMA on a chart
Read groups, not lines: the information is in separation, compression, and the space between cohorts.
- 1Plot the twelve EMAs in their two color-coded groups (3-15 and 30-60) on your timeframe.
- 2Grade the long-term group first: wide, orderly separation marks investor commitment; compression marks a fragile or ending trend.
- 3Read the short-term group against it: pullbacks into a separated long group that bounce are the continuation rhythm; slicing straight through argues character change.
- 4Treat mutual compression and braiding as the range state, where group logic goes quiet and trend entries are shelved.
- 5Reserve the full group-through-group crossover for what it is: a slow structural signal that arrives late and is usually confirmed by structure elsewhere.
How it's calculated
The GMMA plots twelve EMAs as two ribbons, a short-term group tracking trader activity and a long-term group tracking investor activity.
There is no single output value; the reading comes from the separation, compression, and crossovers of the two EMA groups.
Platforms seed the EMAs differently (from the first close or an initial simple average), so early history can differ slightly across charts.
How traders use it
- As a trend-health dashboard: expansion and compression of the investor group are watched continuously, and a compressing long-term group is treated as a fragile trend regardless of what price itself is doing.
- For pullback entries: the classic GMMA continuation setup is the trader group dipping into a separated investor group and bouncing, an MA-stack version of buying tested dynamic support.
- As a slow regime signal: the entire short group crossing the long group is read like a broad moving average crossover, intended to be harder to whipsaw than a two-line cross, though sideways markets still generate false group crosses.
- As an exit manager: trend riders trail against the long group's integrity, tightening or exiting when it compresses or when short-group bounces stop reaching new ground, an earlier tell than any single-line reversal signal.
- As a screening texture: scans for well-ordered stacks (every short EMA above every long EMA, both groups separated) shortlist instruments in the healthy-trend state, the GMMA version of a trend regime label.
Guppy GMMA vs other MA stacks
MA Ribbon: A ribbon is any stack of moving averages at stepped lengths, read for ordering, fanning and compression. The GMMA is a specific, opinionated ribbon: two fixed six-EMA cohorts and an explicit trader-versus-investor interpretation of the gap between the groups.
Rainbow MA Stack: The rainbow builds its lines by recursively smoothing the same average (an MA-of-MA chain), so its bands are mathematically dependent on one another. GMMA lines are each computed independently from price, and the analysis hinges on the two-group structure rather than the full spectrum.
Supertrend: Supertrend compresses trend state into one line and one flip. The GMMA deliberately goes the other way, spreading the state across twelve lines so that the texture, separation, compression, and rhythm remain visible instead of being collapsed into a binary.
Concept family
Trend
100 concepts mapped · 100 in the Library
Guppy GMMA FAQ
Turn Guppy GMMA into a trading strategy.
Take the implementation from this page into Quant, then build on it, backtest it on real data, and keep refining it in conversation.