Historical Price Projection
By LuxAlgoMar 7, 2024

The Historical Price Projection tool is a powerful asset for traders aiming to predict future market movements by leveraging historical data along with a customizable growth factor. This innovative trading indicator can plot a future price forecast with the same price behavior exhibited during a specific historical period, either with or without introducing drift, offering traders substantial flexibility in their market strategy.
The standout feature of this trading indicator is its ability to forecast prices for future periods by mimicking the historical price actions of a user-defined timeframe. Traders have the autonomy to tailor the projection parameters, including defining the growth factor, which can significantly influence the expectancy of the market trends. This customization allows for a wise strategy formation that aligns with both market trends and trader expectations.
How to Trade with Historical Price Projection?
This tool visualizes a price projection that imitates the historical behavior over a user-selected timeline, supplemented by a defined growth factor. It's a mechanism that facilitates traders in hypothesizing how the market might behave under similar conditions again.
To activate this tool, selecting an anchor point is crucial, which can be manually set on your chart by marking a specific bar or through the date field on the settings panel. In performing market analysis, traders often use identifiable phases, such as using the distribution phase, to predict possible outcomes as the market cycles through similar rhythms and tides.
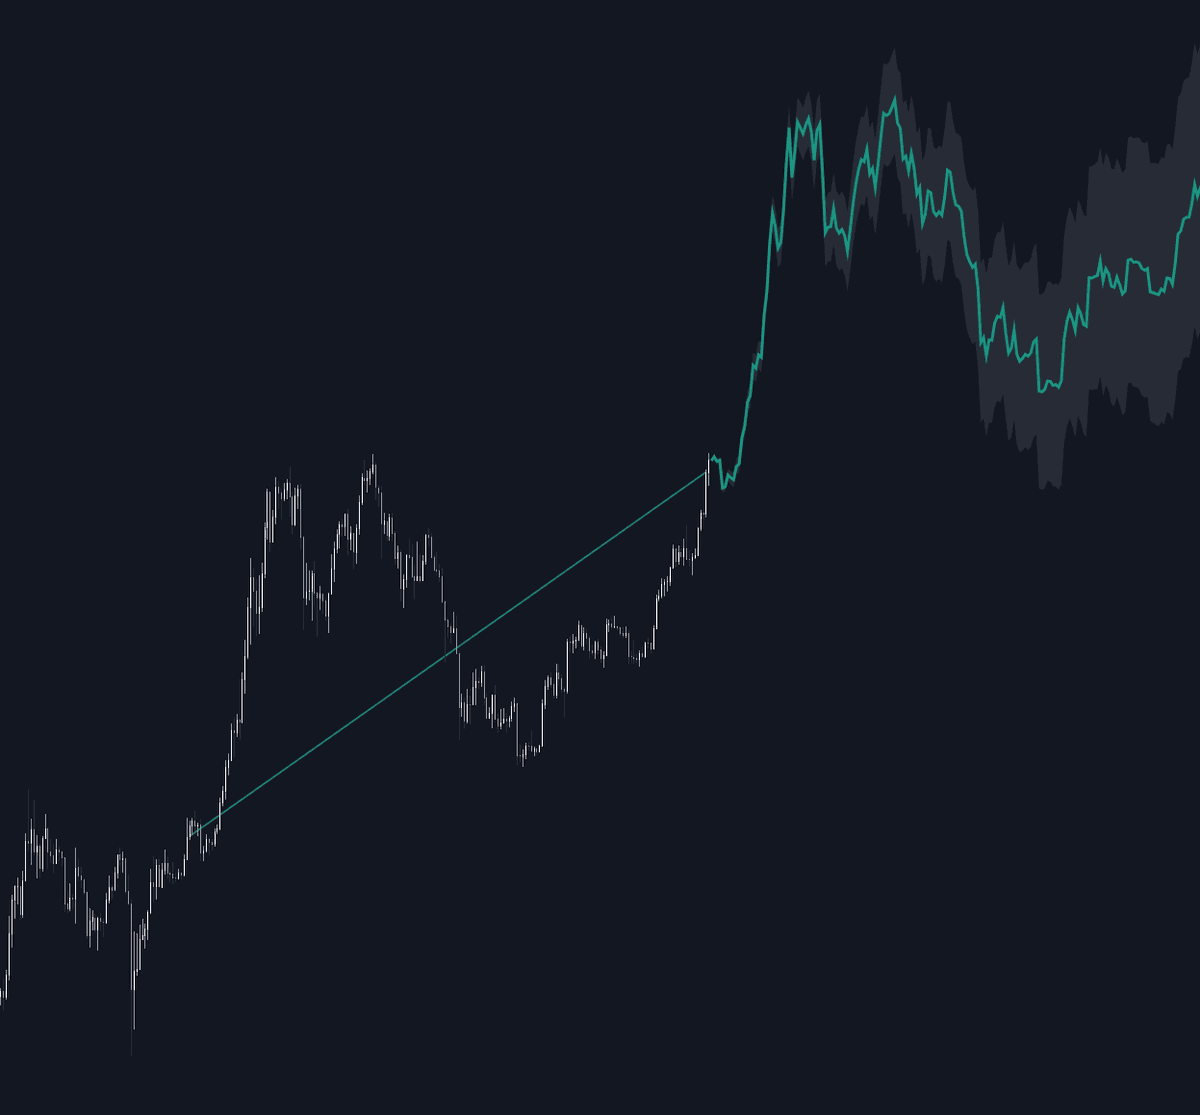
In the aforementioned chart demonstration, setting the growth factor to 0 ensures optimal alignment of the projection with the historical timeline, facilitating enhanced visibility up to 500 bars post the anchor point. The definition of the growth factor centers around a drift percentage used in the projection, which can be pivotal in determining potential turns in market direction.
- For positive return periods, the drift amounts to the average negative return within the span.
- For negative return periods, it considers the average positive return within the span.
Here, selecting a similar time period with a growth factor of 10 introduces a 10% drift, skewing the forecast more negatively, especially if the historical tenor was laden with negative returns. This functionality aids traders in exploring bearish outlooks and strategizing accordingly.
In this scenario, with the accumulation phase as an anchor and a 10% growth factor, the projection leans bullish, benefiting from both a positive historical period and drift influence, showcasing potential explosive price surges in future forecasts enabling dynamic trading strategies.
Using long-term data, such as this quarterly chart of the Dow, allows traders to evaluate what potential pitfalls lie ahead by mirroring historic downturns, such as the crash of '29 in this case, assuming a growth factor of 0 to parallel past behaviors precisely.
Optimizing Settings for Your Trading Strategy
Data Selection and Configuration
- Anchor Point: This starting marker for data analysis utilizes up to 500 bars to derive meaningful projections.
Tailoring Data Transformation
- Growth Factor: From 0 to 100, this parameter adjusts the amount of drift influencing price trajectory forecasts.
- Area Width: Dictates the breadth of the forecast zone relative to the growth factor, tweakable from 0 to 100.
Visualization and Style Preferences
- Price Line Width: Alter the thickness of the price line as per requirement.
- Bullish/Bearish Color Options: Customize the indicator's color scheme to quickly differentiate trend directions.
- Forecast Area Visibility: Toggle forecast zone visibility for strategic planning and analysis.
- Area Color: Choose aesthetic preferences for the area plot.
Frequently Asked Questions
How can I access the Historical Price Projection tool?
You can access the Historical Price Projection tool on the LuxAlgo Library for charting platforms like TradingView, MetaTrader (MT4/MT5), and NinjaTrader for free.
What is the purpose of the growth factor in the Historical Price Projection tool?
The growth factor allows traders to introduce a defined percentage of drift to forecast future prices, offering more nuanced control and better strategizing based on historical market behavior.
Can the Historical Price Projection tool help in predicting market crashes like 1929?
Yes, by utilizing historical data and setting the appropriate growth factor, traders can simulate potential market crashes reminiscent of historical downturns to strategize accordingly.
Free indicator
Get free access to this indicator on the platforms below.
Unlock the entire LuxAlgo Library
Every indicator, every strategy, full charts, and complete access to Quant — our AI agent.