Historical Volatility
 By LuxAlgoApr 13, 2020
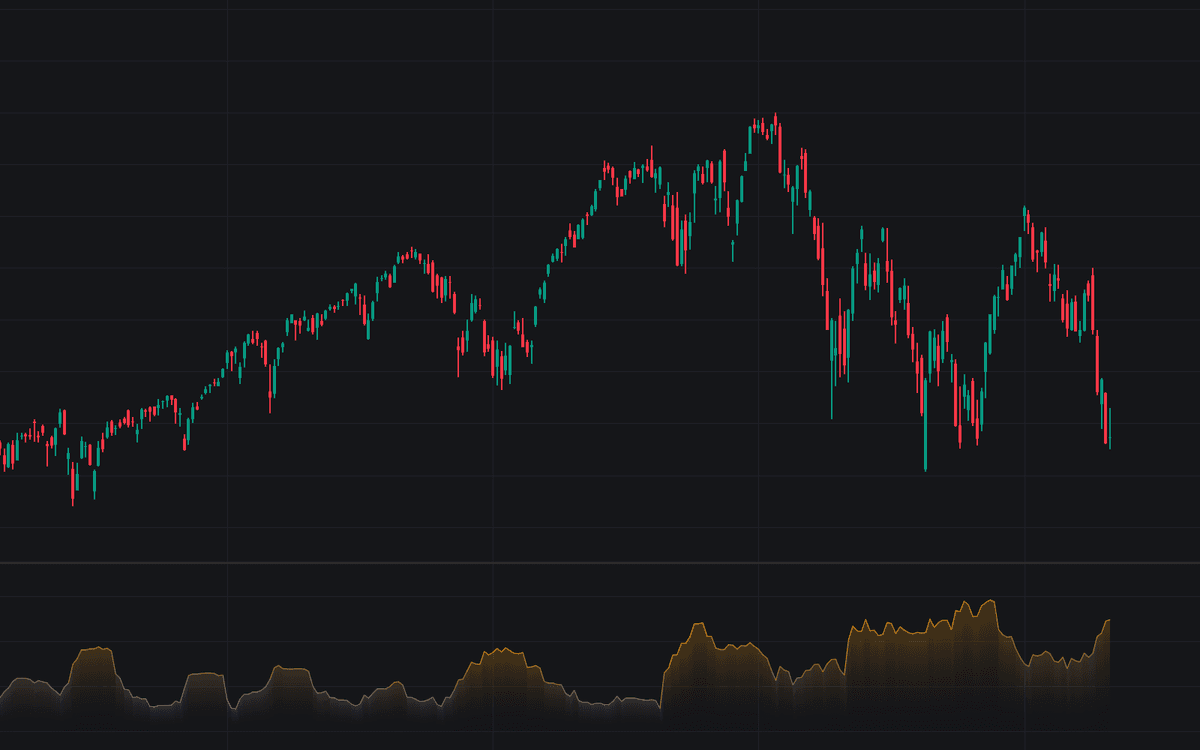

Historical Volatility measures the dispersion of an instrument's returns by taking the standard deviation of logarithmic close-to-close changes over a rolling window and annualizing the result, plotted as a single percentage line. Traders track it to classify quiet versus active regimes, to size positions consistently, and to compare realized movement against what options imply.
This build is the standard raw close-to-close calculation: each bar's log return feeds a sample standard deviation over a 10-bar window, scaled by the square root of 252 periods per year by default, so the line reads directly as an annualized percentage.
How to Trade the Historical Volatility?
- HV low versus its own history: a quiet regime; long compressions often precede expansion.
- HV high versus its own history: an active regime; wider stops and smaller sizes keep risk per trade comparable.
- HV as a sizing denominator: scaling risk budgets by the current reading evens exposure across symbols.
- HV versus implied volatility: the spread between implied and realized frames whether option premium is rich or cheap.
The reading is direction-blind and normal levels differ across markets, so compare it with the same symbol's history rather than fixed thresholds.
Historical Volatility Settings
- Length (default 10): the lookback for the standard deviation of close-to-close log returns. Short windows track the regime closely but jump on every large return; longer ones are steadier but slower.
- Annualize (default on): scales per-bar volatility to an annual figure by multiplying by the square root of the periods per year.
- Periods Per Year (default 252): the annualization basis: 252 for daily bars, 52 for weekly, 12 for monthly.
Frequently Asked Questions

The Library is free. Quant makes it yours.
Pull any concept or indicator into Quant: rebuild it, retune it, or turn it into a backtested strategy of your own.