Concept
Close-to-close Historical Volatility
Close-to-close Historical Volatility, also known as standard deviation of log returns, is a Volatility concept. The Library holds 1 implementation, a working definition you can pull into Quant.
The standard Close-to-close Historical Volatility indicator
Close-to-close Historical Volatility exactly as classically defined: the faithful reference build of the original formula, free to run in Quant.
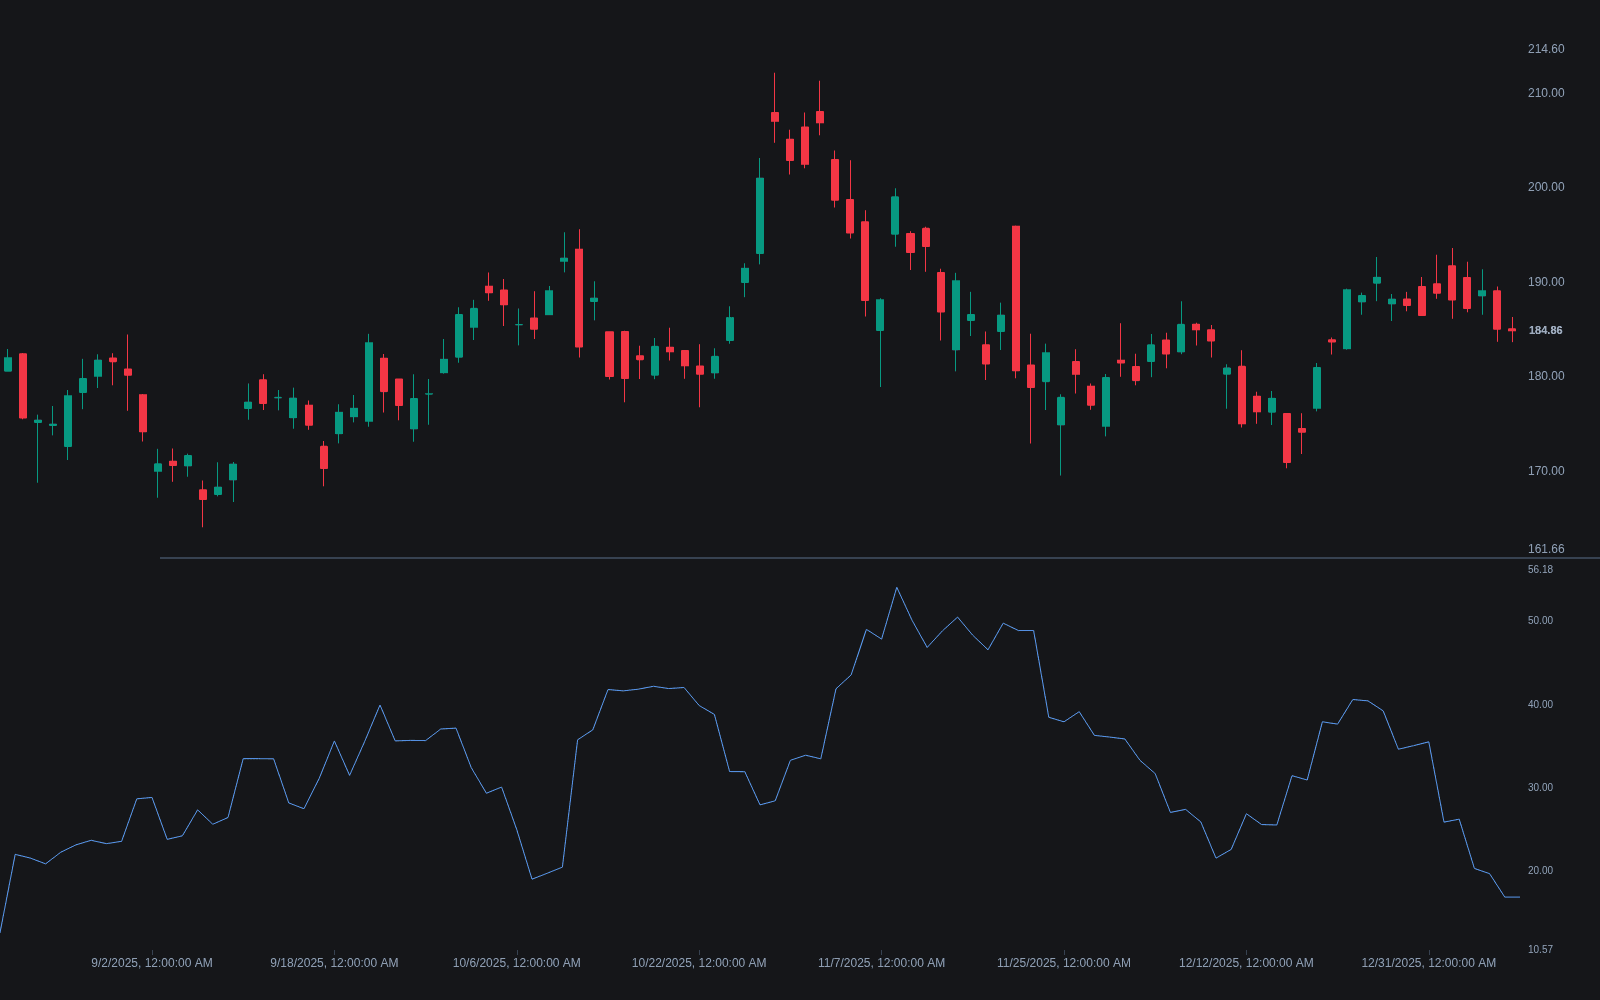
What is Close-to-close Historical Volatility?
Close-to-close historical volatility is the standard deviation of logarithmic returns computed from closing prices, usually annualized and quoted as a percentage. Each period's return is the natural log of the current close divided by the prior close; the estimator takes the standard deviation of those returns over a lookback window and multiplies by the square root of the number of periods per year (√252 is the convention for daily data on markets with roughly 252 trading days). It is the oldest and most widely quoted volatility estimator, and the default meaning of "historical volatility" or "HV" unless another estimator is named.
Its strengths and weaknesses both come from using only closes. It needs no open, high, or low data, it captures overnight gaps because each close-to-close return spans them, and it makes minimal assumptions. But it discards everything price did inside the bar, so range-based estimators such as the Parkinson estimator or the Yang-Zhang estimator can reach similar precision from less data by using each bar's high-low information. It also lags by construction: one large return inflates the estimate for the whole window and then drops out abruptly, which is a key motivation for exponentially weighted variants.
How to calculate close-to-close historical volatility
The calculation is four short steps; the only real choices are the lookback window and the annualization factor.
- 1Compute log returns: for each bar, take the natural logarithm of the close divided by the previous close.
- 2Take the standard deviation of those returns over the lookback window (20 and 30 periods are common on daily data); some implementations assume a zero mean rather than subtracting the sample mean, which matters little at daily horizons.
- 3Annualize by multiplying by the square root of the number of periods per year: √252 for daily equity data, √365 often used for markets that trade every day, √52 for weekly data.
- 4Express the result as a percentage, so 0.25 reads as 25% annualized volatility, comparable across instruments and against implied volatility quotes.
How it's calculated
Annualized standard deviation of close-to-close log returns, the standard realized volatility estimate.
The sample divisor (n - 1) is most common; some implementations divide by n or assume a zero mean.
Match A to the bar frequency: 252 daily, 52 weekly, 12 monthly.
This estimator ignores intrabar range; Parkinson and Garman-Klass estimators use high/low data for more efficiency.
How traders use it
- As a regime gauge: comparing current HV to its own history, often via a volatility percentile, classifies quiet versus active conditions and drives regime-switching logic.
- As the realized leg in options analysis: the spread between implied volatility and trailing HV frames whether options are priced rich or cheap relative to what the underlying has actually delivered.
- As a risk denominator: volatility-targeted sizing and stop-distance rules scale positions by HV so risk per trade is more uniform across instruments and regimes.
- As the benchmark estimator: more elaborate volatility estimators are routinely judged by how much efficiency they add over plain close-to-close on the same data.
Close-to-close Historical Volatility vs related concepts
ATR: Measures average bar range in price units rather than the dispersion of percentage returns, and is not annualized. ATR suits stop distances on a single chart; HV supports cross-instrument comparison and options work.
Realized Volatility: In the academic sense, realized volatility sums squared intraday returns from high-frequency data to estimate a single day's volatility; close-to-close HV is the low-frequency cousin. In casual usage the two terms often blur.
EWMA Volatility: Replaces the equal-weighted window with exponentially decaying weights, so recent returns dominate and a single large return fades out smoothly instead of dropping off a cliff when it leaves the window.
Concept family
Volatility
57 concepts mapped · 57 in the Library
Close-to-close Historical Volatility FAQ
Turn Close-to-close Historical Volatility into a trading strategy.
Take the implementation from this page into Quant, then build on it, backtest it on real data, and keep refining it in conversation.