HTF Fair Value Gap
 By LuxAlgoSep 21, 2023
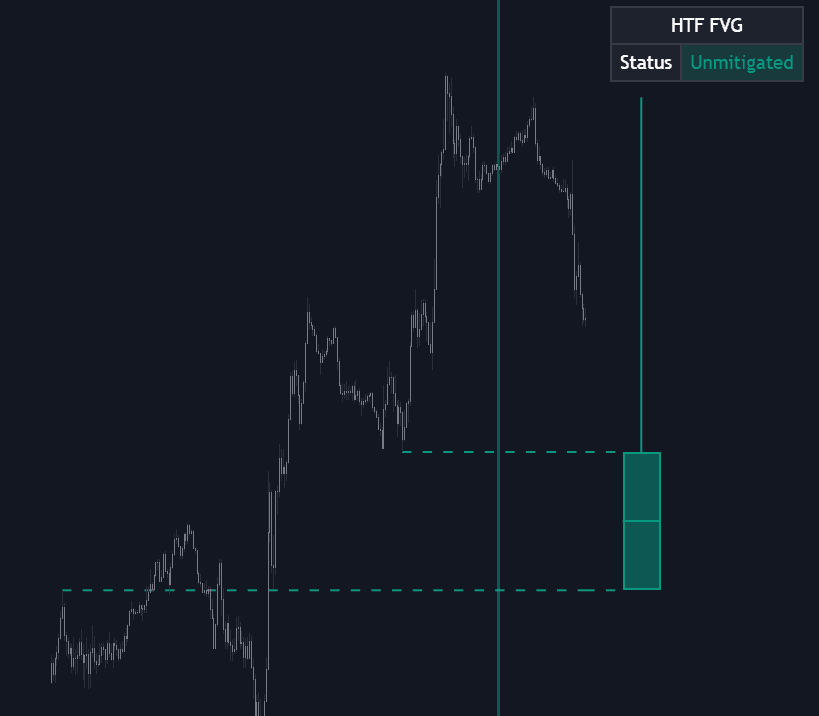
HTF Fair Value Gap detects fair value gaps on a higher timeframe of your choosing and keeps them in front of you while you execute on a lower one. Background shading flags every higher timeframe gap as it occurs (green for bullish, red for bearish) while the most recent gap is rendered as a candle offset to the right of price, its dashed lines marking the gap's upper and lower boundaries and its wicks recording price's deviations from those boundaries since formation. A Status dashboard completes the picture, reporting whether the gap has been mitigated.
How to Trade the HTF Fair Value Gap?
- Green background: a bullish higher timeframe gap has printed, momentum context that favors long-side ideas on the trading timeframe.
- Red background: the bearish equivalent, flagging downside imbalance from above your chart.
- Dashed boundary lines: the most recent gap's edges are natural reference levels for entries, stops, and targets as price rotates back into the zone.
- Solid border on the FVG candle: the gap remains unmitigated. The imbalance is still open, and the level retains its draw on price.
The wicks on the projected candle deserve attention: they summarize post-formation excursions from the gap's boundaries, a compact read on whether the gap is holding within the ongoing trend or being ground down.
HTF Fair Value Gap Settings
- Timeframe: the higher timeframe scanned for fair value gaps.
- Offset and Width: where the projected FVG candle sits relative to the last bar, and how many bars wide it draws.
- Dashboard inputs: visibility, location, and size of the Status dashboard.
Frequently Asked Questions
Free indicator
Get free access to this indicator on the platforms below.

The Library is free. Quant makes it yours.
Pull any concept or indicator into Quant: rebuild it, retune it, or turn it into a backtested strategy of your own.