Keltner Channels
 By LuxAlgoApr 13, 2020
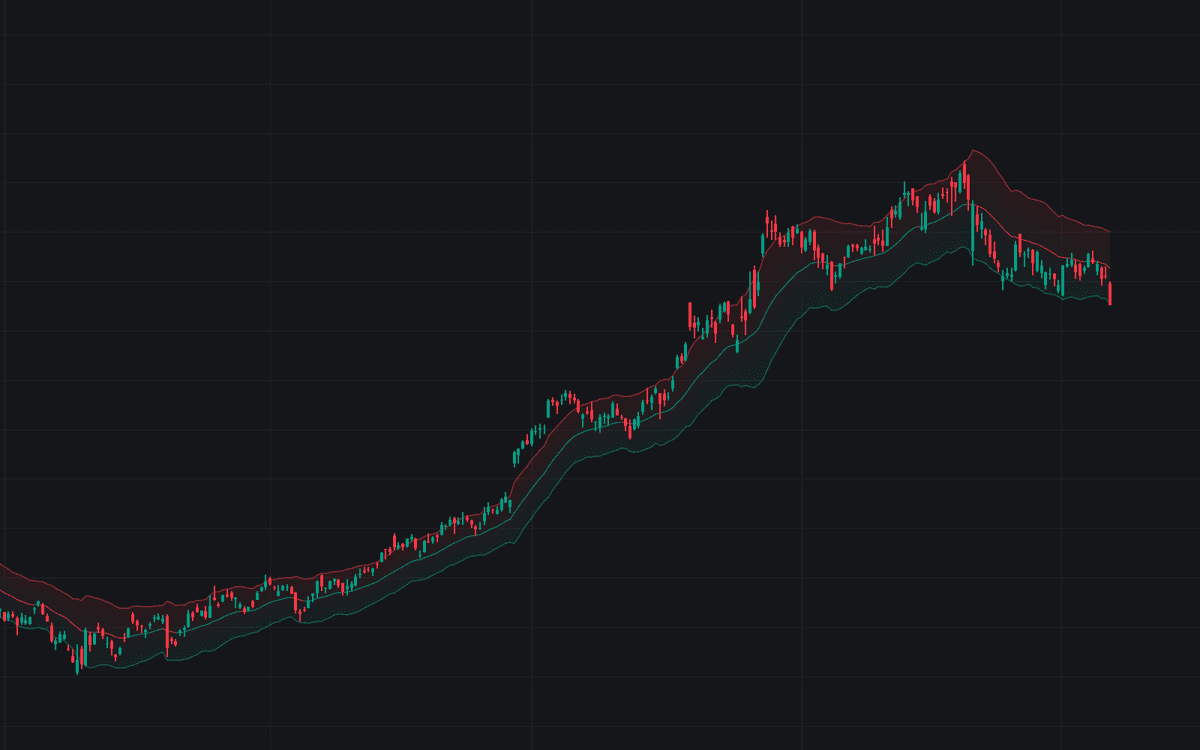

The Keltner Channels indicator plots a volatility-based channel around price: a 20-period EMA centerline with upper and lower bands offset by 2 times the 10-period average true range. Because the offset is denominated in ATR, a band touch always carries the same meaning: price has moved a long way relative to its own recent true range. The build follows the standard modern ATR-based formula with its usual EMA 20, ATR 10, and multiplier 2 defaults, plotting the Basis, Upper, and Lower lines with a channel fill between the bands.
How to Trade the Keltner Channels?
- Rising Basis with price between Basis and Upper band: a healthy uptrend; pullbacks into the Basis are the conventional continuation zone.
- Price walking the Upper band: persistent contact on the trend side reads as strength rather than overextension; mirror it for the Lower band in downtrends.
- Close beyond a band while the Basis is flat: stretch without trend backing, the condition mean-reversion traders fade back toward the centerline.
- Channel width: widening accompanies a developing trend; tightening marks compression that often precedes expansion.
Anchor every read to the Basis slope: the same band touch means opposite things in trending and ranging tape.
Keltner Channels Settings
- EMA Length (default 20): bars in the exponential moving average that forms the Basis.
- ATR Length (default 10): lookback for the Average True Range that sets band distance.
- Multiplier (default 2): ATR multiple offsetting the Upper and Lower bands. Higher for fewer, more selective touches.
- Source (default close): price series used to compute the Basis line.
Frequently Asked Questions

The Library is free. Quant makes it yours.
Pull any concept or indicator into Quant: rebuild it, retune it, or turn it into a backtested strategy of your own.