Concept
Keltner Channels
Keltner Channels are Volatility concepts. The Library holds 1 implementation, a working definition you can pull into Quant.
The standard Keltner Channels indicator
Keltner Channels exactly as classically defined: the faithful reference build of the original formula, free to run in Quant.
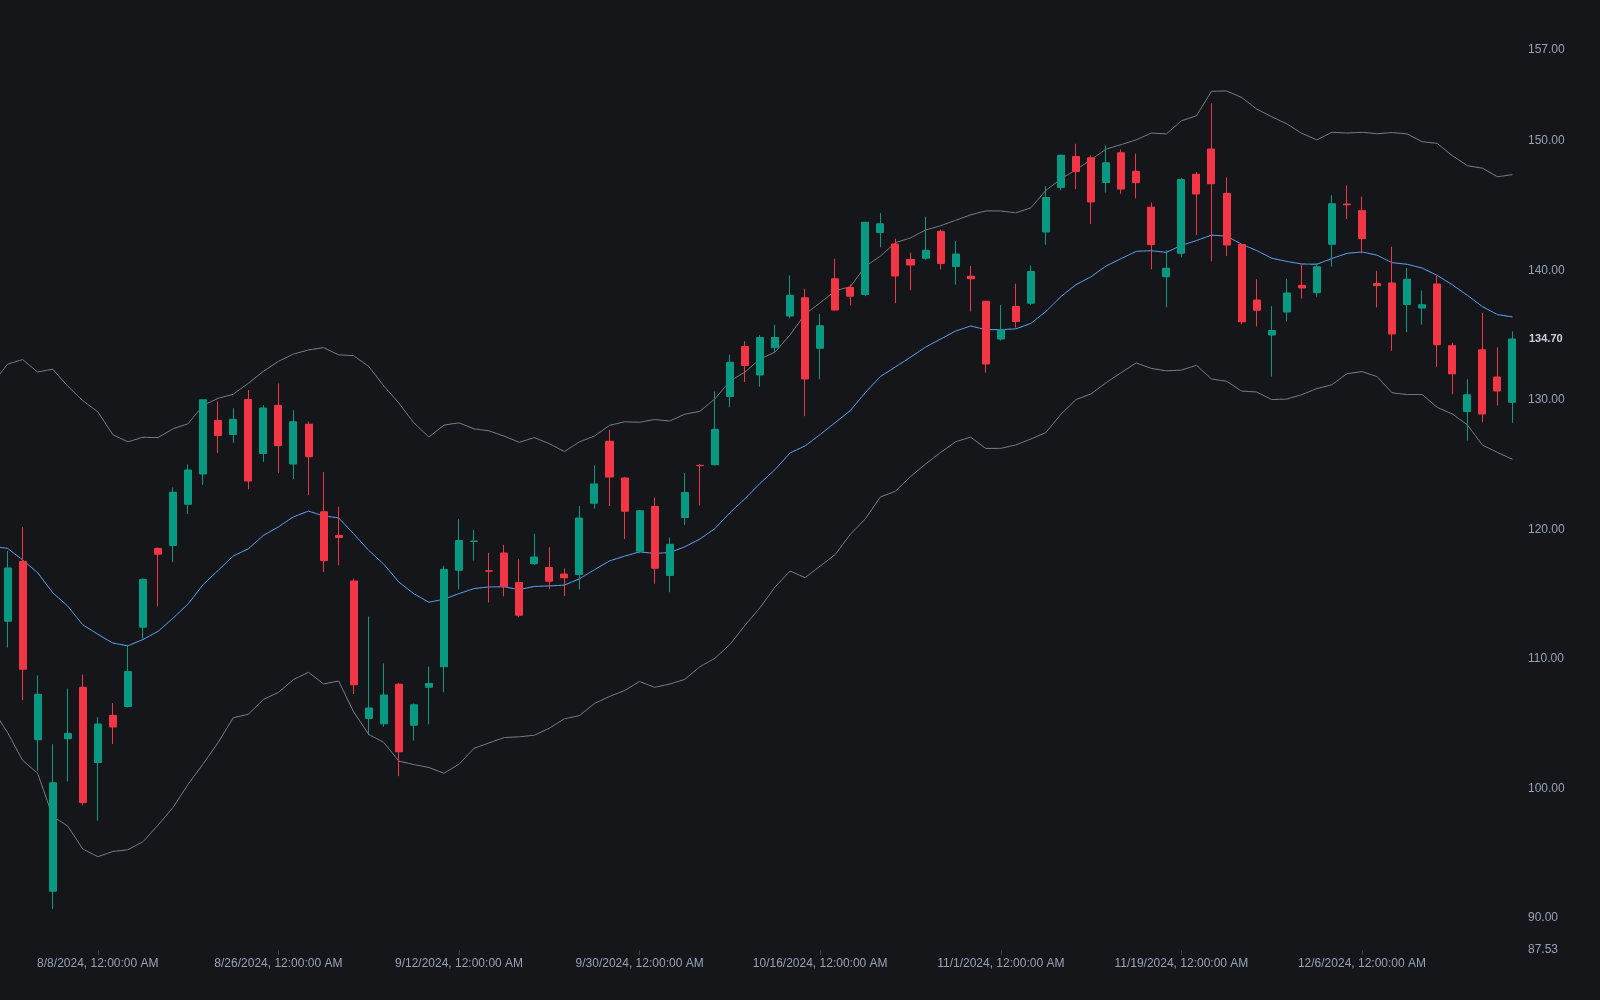
What are Keltner Channels?
Keltner Channels are volatility bands drawn around a moving average with the offset set by average true range: a midline (commonly a 20-period EMA) plus an upper and lower band at the midline plus or minus a multiplier (commonly 1.5 to 2) times ATR. The name comes from Chester Keltner, whose 1960 version used a simple moving average of typical price offset by the average daily range; the EMA-and-ATR form in common use today was popularized decades later by Linda Bradford Raschke.
The evolution is worth knowing because both versions still circulate. Keltner published his ten-day moving average trading rule in a 1960 commodities book, offsetting by the plain average of daily ranges; the modern rewrite swapped in the exponential midline and Wilder's true range, which folds opening gaps into the offset. Platforms differ in defaults and occasionally in which construction they implement, so two charts labeled Keltner can disagree.
Because ATR is itself a smoothed measure that includes gaps, Keltner Channels widen and tighten more gradually than Bollinger Bands, whose standard-deviation width reacts sharply to volatility clusters. That steadiness is the point: the channel gives a calmer definition of normal distance from the mean, which suits trend-following reads (price traveling between the midline and an outer band) and makes it the reference container in the TTM Squeeze, where Bollinger Bands contracting inside the Keltner Channel defines compression.
Reading the channel is mostly reading the midline and the touches. The midline's slope carries the bias; in a healthy trend price oscillates between the midline and the outer band on the trend's side, and a persistent walk along that band marks strength rather than overextension. Channel width itself is a volatility dial: gradual widening accompanies developing trends, while contraction marks compression, the Keltner-side reading of range expansion and contraction.
How to calculate Keltner Channels
The modern construction takes three inputs: a midline length, an ATR length, and a multiplier.
- 1Compute the midline: a 20-period EMA of closing price is the common modern choice (Keltner's original used a 10-period SMA of typical price).
- 2Compute ATR over its own lookback, often 10 to 20 periods, so the offset reflects recent true range including any gaps.
- 3Set the bands: upper = midline + multiplier × ATR and lower = midline - multiplier × ATR, with 1.5 to 2 as typical multipliers.
- 4Tune to the instrument: a multiplier that contains most candles on one market can be far too tight or loose on another, so calibrate by inspection or testing rather than assuming defaults transfer.
- 5Then read the state: midline slope for bias, touches and band walks for trend strength, and width changes for the compression-expansion cycle.
How it's calculated
A volatility channel that wraps an EMA basis with bands offset by a multiple of Average True Range.
Wilder smoothing: ATR_t = ((p - 1) × prior ATR + TR_t) / p; some platforms use an EMA or SMA of TR instead.
These are the Linda Raschke settings most platforms implement; common defaults are n = 20, m = 2, and p = 10 or 14.
Chester Keltner's 1960 original used a 10-day SMA of typical price (H + L + C) / 3 with bands offset by the 10-day SMA of H - L.
How traders use it
- As a trend channel: in a healthy trend price tends to travel between the midline and the outer band, with pullbacks to the midline acting as dynamic support or resistance for continuation entries.
- As a breakout trigger: a close beyond a band marks movement beyond recent average range, which trend traders read as strength to join rather than fade; in ranges, the same close more often flags overextension.
- As the container in squeeze logic: Bollinger Bands trading inside the Keltner Channel defines compression, the condition behind the TTM Squeeze family of setups.
- As a stop or exit rail: the midline or the opposite band serves as a trailing reference that adapts to volatility, similar in spirit to other ATR-based trailing methods.
- As a regime dial: tracking channel width against its own history, the Keltner analog of Bollinger BandWidth, flags whether the market is compressing toward a break or already extended, before any directional read is attempted.
Keltner Channels vs related concepts
Bollinger Bands: Bands scaled by the standard deviation of price rather than ATR, so they flare and pinch faster. Keltner width is smoother and folds gap risk in through true range. Many traders run both and trade their interaction.
ATR Bands: The generic form of the same idea: ATR offsets around any baseline. Keltner Channels are effectively the canonical parameterization (EMA midline, roughly 1.5 to 2 × ATR), and the two names are sometimes used interchangeably.
STARC Bands: Stoller's channel also offsets by ATR, but around a short simple moving average, and is traditionally read for counter-trend band-tag trades rather than for trend riding.
Concept family
Volatility
57 concepts mapped · 57 in the Library
Keltner Channels FAQ
Turn Keltner Channels into a trading strategy.
Take the implementation from this page into Quant, then build on it, backtest it on real data, and keep refining it in conversation.