Linear Regression
 By LuxAlgoApr 13, 2020
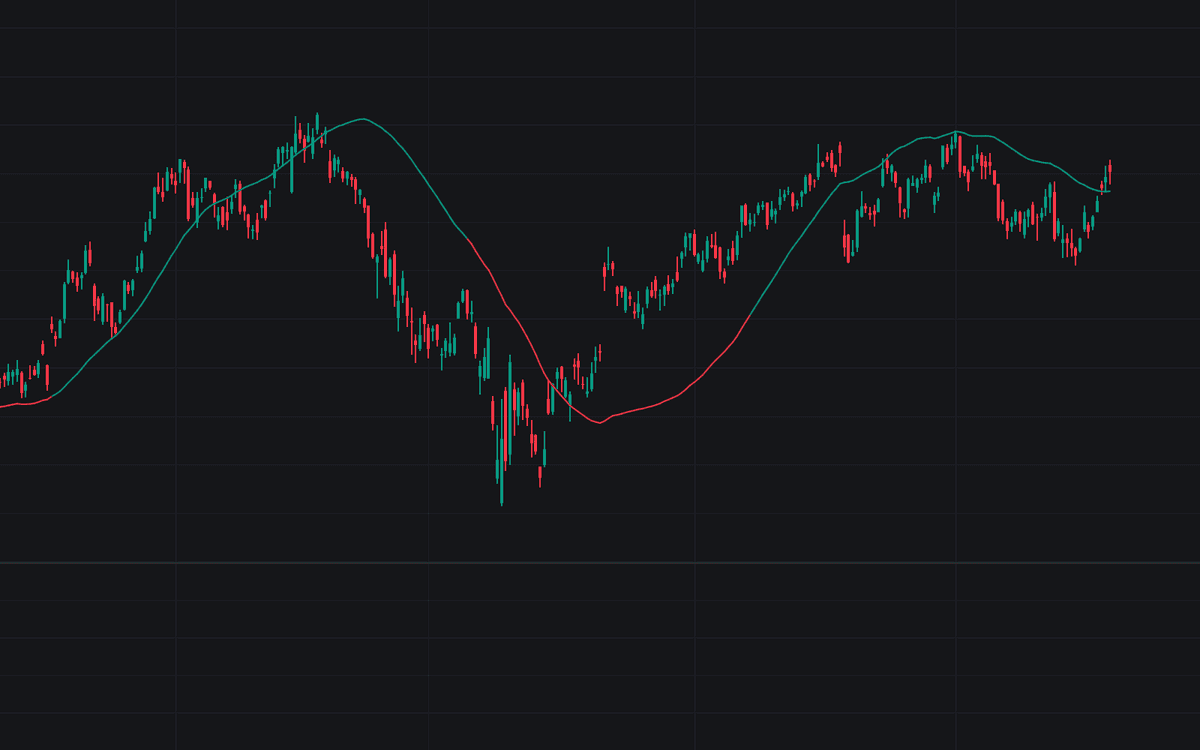

The Linear Regression indicator fits a least-squares regression to price over a 100-bar lookback and displays the result according to a Mode input: a regression curve drawn on the price chart (default), the per-bar slope of the fit, or a channel around the fitted line with bands offset by two standard deviations of price around the fit. It shows where price sits relative to its statistical trend over the window, using the standard least-squares method with no proprietary adjustments. The Slope plots in the pane around a dashed zero line.
How to Trade the Linear Regression?
- Price above or below the Curve: the source trading above the fitted value means price sits above its statistical trend; sustained readings on one side describe a directional window.
- Slope above zero: positive per-bar drift in the fit, an objective trend-direction read, with zero-line crossings marking inflections.
- Steepening or flattening Slope: acceleration or deceleration of the fitted trend, often visible before direction changes.
- Price at a Channel band: roughly two deviations from the fitted line. Stretched within the window, with the base line as the fair-value reference.
Linear Regression Settings
- Mode (default Curve): selects the display: Curve on the price chart, Slope in the pane, Channel as the fitted line and deviation bands over the last Length bars.
- Length (default 100): number of bars used to fit the regression. Longer for a steadier trend estimate.
- Source (default close): price series the regression is fitted to.
- Deviation Multiplier (default 2): channel band offset in standard deviations of price around the fitted line, also used by the band cross alerts.
Frequently Asked Questions

Original indicatorBuilt in-house by LuxAlgo
The Library is free. Quant makes it yours.
Pull any concept or indicator into Quant: rebuild it, retune it, or turn it into a backtested strategy of your own.