Concept
Linear-regression Channel
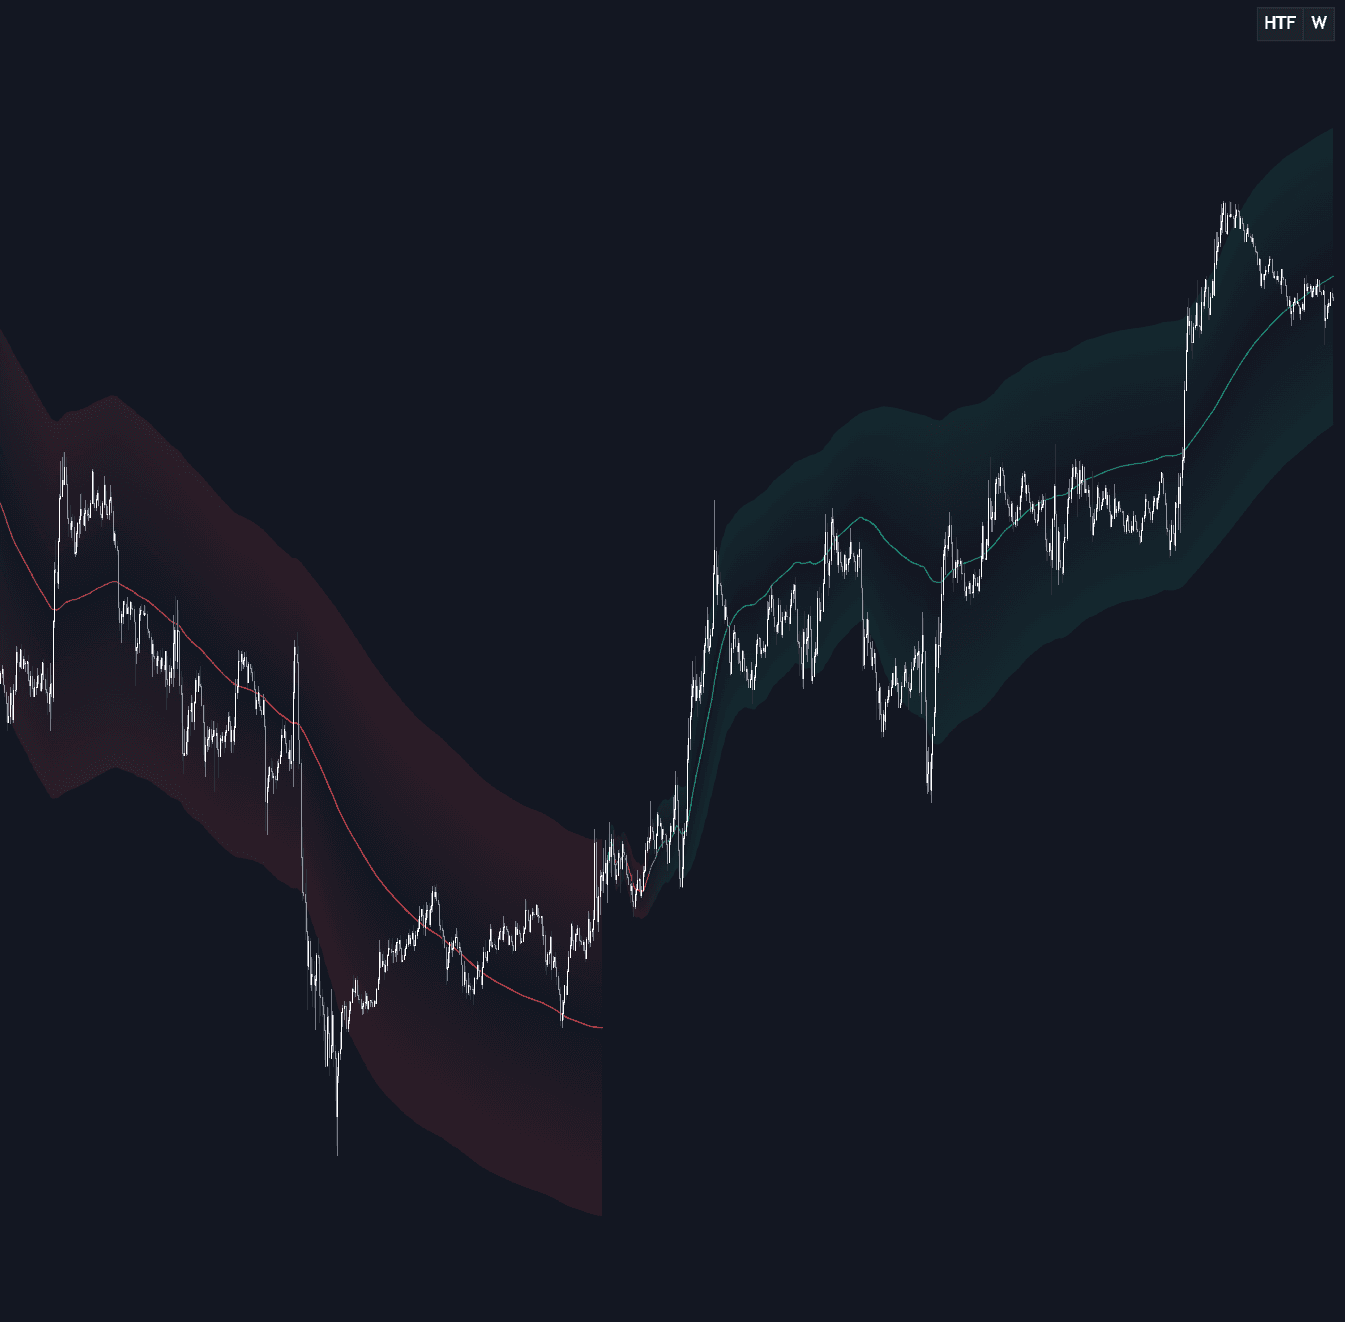
Linear-regression Channel is a Trend concept. The Library holds 6 implementations, each one a working definition you can pull into Quant.
Top Linear-regression Channel indicators
The top custom implementations, built on the original standard Linear-regression Channel formula.
6 total
From studying Linear-regression Channel to trading it: take any implementation below into Quant and backtest it instantly.
.png&w=3840&q=75)
.png&w=3840&q=75)
The standard Linear-regression Channel indicator
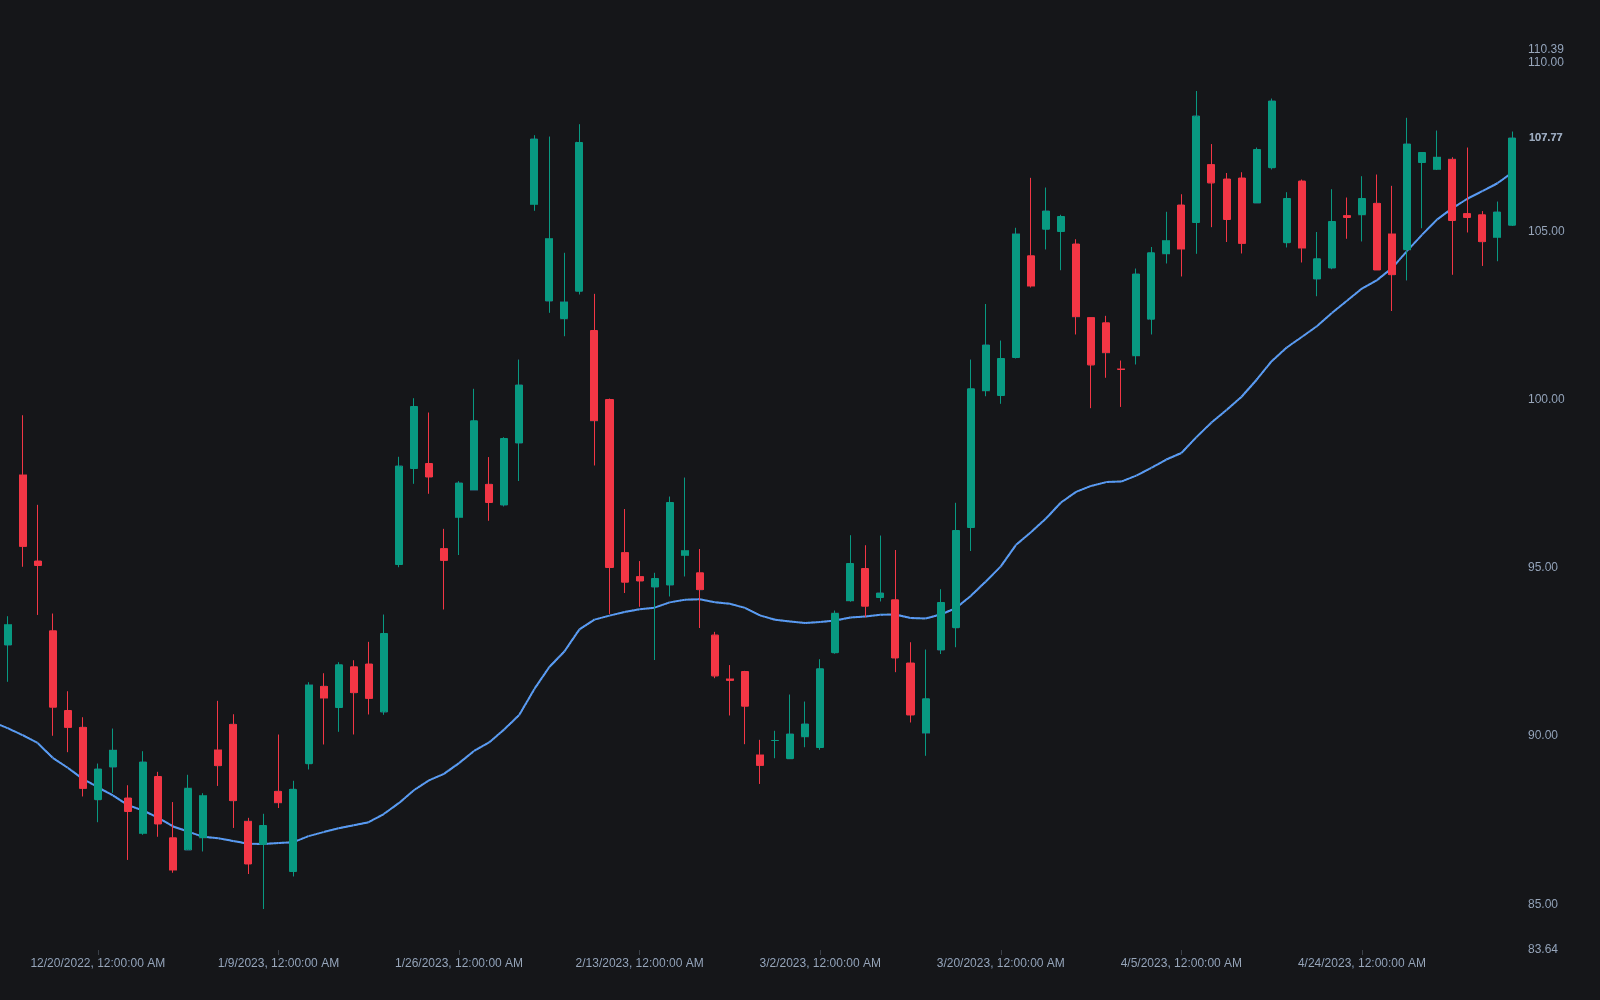
Linear-regression Channel exactly as classically defined: the faithful reference build of the original formula, free to run in Quant.
What is a Linear-regression Channel?
A linear-regression channel fits a straight line to price over a fixed lookback using ordinary least squares, the same fit described under linear regression: the line that minimizes the sum of squared vertical distances to the closes. Parallel boundaries are then offset above and below that midline, most often by a multiple of the standard deviation of the residuals (how far closes actually sat from the line), sometimes by the maximum deviation, measured to the furthest high or low, so the channel encloses every bar in the window. The midline is the window's statistical trend; the offsets describe the typical spread around it.
Reading one is mechanical. The slope gives trend direction and steepness, the width gives volatility around that trend, and price's position inside the channel says how stretched the current bar is relative to its own fit. Two caveats keep it honest. The channel is only as good as its window: change the lookback and the slope, width, and apparent extremes all change with it. And because the whole segment is refit as new bars arrive, boundary touches that look precise in hindsight were drawn somewhere else when they printed.
How to construct a linear-regression channel
The construction is fully mechanical, which is why most platforms automate it:
- 1Choose a lookback of N bars and fit an ordinary least-squares line to the closes in that window; this is the channel midline.
- 2Measure dispersion around the fit: compute the standard deviation of the residuals (close minus line value), or take the largest distance from the line to any high or low if the channel should contain every bar.
- 3Draw parallels offset above and below the midline by the chosen multiple, commonly 1 to 2 standard deviations.
- 4Refit on each new bar for the rolling version, or anchor the start to a fixed swing point; only a window with both ends fixed yields a drawing that stops changing.
How it's calculated
A least-squares trendline fitted to the last N prices, with parallel bands offset a fixed number of standard deviations above and below it.
The fit is recomputed on every new bar, so the whole channel redraws over its lookback window.
Variants offset the bands by the maximum absolute deviation instead of k × σ (the Raff Regression Channel), or divide by N - 2 when estimating σ.
A Pearson's R readout often accompanies the channel to grade how linear the window is.
How traders use it
- As a trend qualifier: a steep, tight channel describes an efficient trend, a flat one a range; many traders only take pullback entries toward the midline when the slope agrees with their direction.
- As a stretch gauge: tagging the outer band marks price at an unusual distance from its own fit, the regression cousin of a high z-score, and a common trigger for fade-back-to-midline trades in flat channels.
- As breakout context: a decisive close outside the channel says the current fit no longer contains price, either acceleration in-trend or the start of a breakout against it.
- As a comparison frame across lookbacks: nesting a short channel inside a longer one shows whether the near-term fit is rotating away from the higher-timeframe trend.
Linear-regression Channel vs other channel tools
Standard-error Channel: Same least-squares midline, but the offsets use the regression's standard error rather than a residual standard-deviation multiple. The two are close cousins and platforms mix the names; both narrow when the fit is tight.
Parallel Channel: Drawn by hand through selected swing pivots, so the boundaries encode a structure read and must touch the extremes. The regression channel is computed from every close and cares about the average miss, not the touches.
Bollinger Bands: Bands around a moving average that bends with price, with width from rolling standard deviation. A regression channel is built around one straight line per window, so it states a trend hypothesis rather than following price.
More Linear-regression Channel implementations
Concept family
Trend
100 concepts mapped · 100 in the Library
Linear-regression Channel FAQ
Turn Linear-regression Channel into a trading strategy.
Take any implementation from this page into Quant, then build on it, backtest it on real data, and keep refining it in conversation.