MA of MA
 By LuxAlgoJun 10, 2026
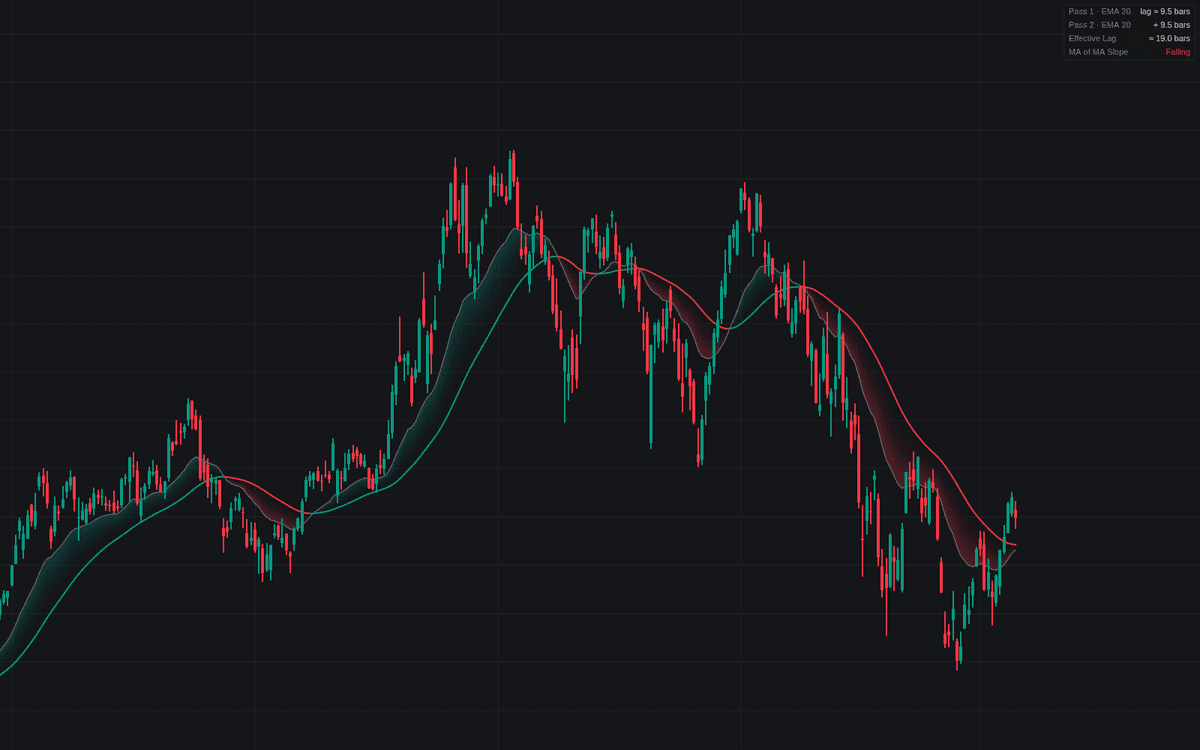

MA of MA feeds one moving average into another and plots both lines on the price chart, the reference build of the MA of MA cascade. Each pass picks its own type (SMA, EMA, WMA, RMA, HMA or VWMA) and length, defaulting to an EMA 20 smoothed by a second EMA 20, and a dashboard totals the stack's nominal lag in bars. An optional lag-reduced line turns the same two passes into a DEMA-style fast line instead.
How to Trade the MA of MA?
- First MA crosses the MA of MA: the fast line turning through its double-smoothed copy approximates a slope change of the first average, the turn-detector read.
- Source crosses the MA of MA: price reclaiming or losing the slow baseline is the regime signal, with alerts both ways.
- MA of MA slope flips: with slope coloring on, the line paints by its own direction and changes state rarely by construction.
- Widening gap: the gradient fill between the fast series and the baseline deepens as a trend accelerates.
Every signal arrives later than its single-average equivalent. That is the deal; check the effective-lag row against your holding period, and compare with the other trend tools.
MA of MA Settings
- Source (default close): series fed into the first pass; jagged inputs like volume suit double smoothing.
- First Pass (default EMA, length 20): the average applied directly to the source.
- Second Pass (default EMA, length 20): the average applied to the first average rather than to price; the passes may differ in type and length.
- Lag-Reduced Line (2 × MA − MA of MA) (default off): DEMA-style combination that strips out the bulk of the stacked lag.
- Show Dashboard (default on), plus Position and Size.
- Style toggles: Slope Trend Coloring (on), Gradient Fill (First MA ↔ MA of MA) and MA Crossing Markers (off).
Frequently Asked Questions

Original indicatorBuilt in-house by LuxAlgo
The Library is free. Quant makes it yours.
Pull any concept or indicator into Quant: rebuild it, retune it, or turn it into a backtested strategy of your own.