Model Stacking
 By LuxAlgoMay 30, 2026
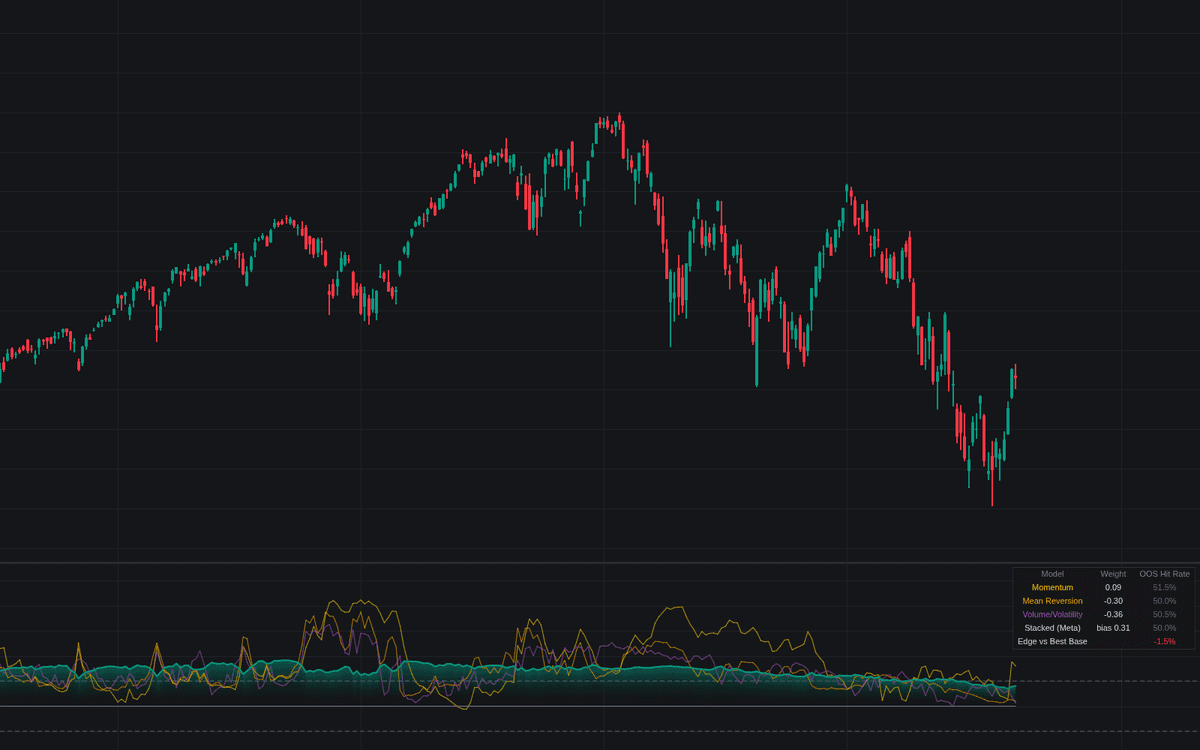

Model Stacking runs a stacked ensemble bar by bar: three logistic base learners (momentum, mean reversion and volume/volatility) and a meta-learner that blends their outputs into one probability of price closing higher after the prediction horizon. The mechanical heart of model stacking is respected: every stored base prediction is out-of-fold, made before its outcome is known or trained on. The stacked line plots 0-100% with a gradient fill, dashed thresholds and, optionally, the three base probabilities behind it.
How to Trade the Model Stacking?
- Cross above the Upper Threshold: decisively bullish; below the Lower Threshold is the bearish mirror, both alerted, as are 50% midline crosses.
- Line hugging 50%: the bases disagree or the ridge penalty is keeping the combiner cautious. The stack has no opinion, itself usable information.
- Read the dashboard first: each base's learned weight and out-of-sample hit rate, the stack's own hit rate, and its edge over the best base: whether blending adds anything here.
Model Stacking Settings
- Prediction Horizon (default 5): bars ahead each model predicts.
- Feature Length (default 14): lookback behind the nine normalized features.
- Training Window (default 200): resolved out-of-fold samples kept for training and hit-rate measurement.
- Base Learning Rate (default 0.5) and Meta Learning Rate (default 0.2): gradient steps of the once-per-bar, walk-forward training pass.
- Meta Ridge (L2) (default 0.02): shrinks the meta weights so the combiner stays simple.
- Upper Threshold (default 60) and Lower Threshold (default 40): the decisive-signal levels.
- Show Base Model Probabilities (on) and Show Dashboard (on, Top Right, Small).
Frequently Asked Questions

Original indicatorBuilt in-house by LuxAlgo
The Library is free. Quant makes it yours.
Pull any concept or indicator into Quant: rebuild it, retune it, or turn it into a backtested strategy of your own.