Money Flow Index
 By LuxAlgoApr 13, 2020
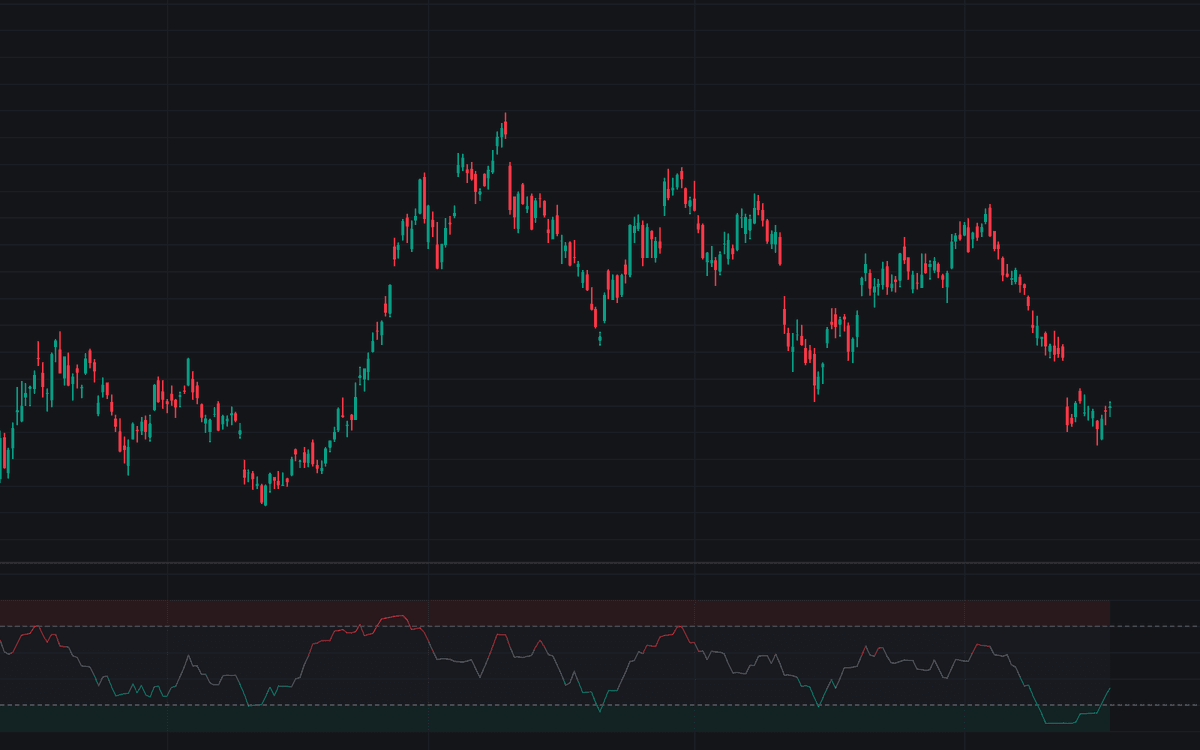

The Money Flow Index is a volume-weighted oscillator bounded between 0 and 100 that compares positive and negative money flow over a lookback window. Each bar's typical price (the average of high, low, and close) is multiplied by volume to form raw money flow, assigned to the positive or negative side by whether typical price rose or fell, and combined into a percentage: the share of dollar-weighted flow that was positive. Defaults follow the classic configuration of length 14 with overbought and oversold reference levels at 80 and 20, the standard published formula with no modifications.
How to Trade the Money Flow Index?
- MFI above the Overbought level (80): dollar-weighted buying dominated the window, a condition to monitor, not an automatic fade.
- MFI below the Oversold level (20): the mirrored condition on the selling side.
- Cross back through a level: exits from the extreme zones are the conventional timing read, marking flow beginning to rebalance.
- Divergence with price: a fresh price high the MFI declines to confirm says the latest push carried less money flow than the one before it.
Crosses out of the zones tend to be more actionable than entries into them, and the shaded area between the dashed levels marks the neutral zone.
Money Flow Index Settings
- Length (default 14): bars used to sum positive and negative money flow. Longer steadies the oscillator and makes extremes rarer.
- Overbought Level (default 80): level above which the MFI is considered overbought.
- Oversold Level (default 20): level below which the MFI is considered oversold.
Alerts
Level crossings are covered in both directions: Enter Overbought and Exit Overbought fire around the overbought level, while Enter Oversold and Exit Oversold fire around the oversold level.
Frequently Asked Questions

The Library is free. Quant makes it yours.
Pull any concept or indicator into Quant: rebuild it, retune it, or turn it into a backtested strategy of your own.