Concept
Money Flow Index
Money Flow Index is a Volume & Order Flow concept. The Library holds 3 implementations, each one a working definition you can pull into Quant.
MFI
Top Money Flow Index indicators
The top custom implementations, built on the original standard Money Flow Index formula.
3 total
Any of the 3 Money Flow Index implementations below can become a backtested trading strategy — describe your rules and Quant writes the code.
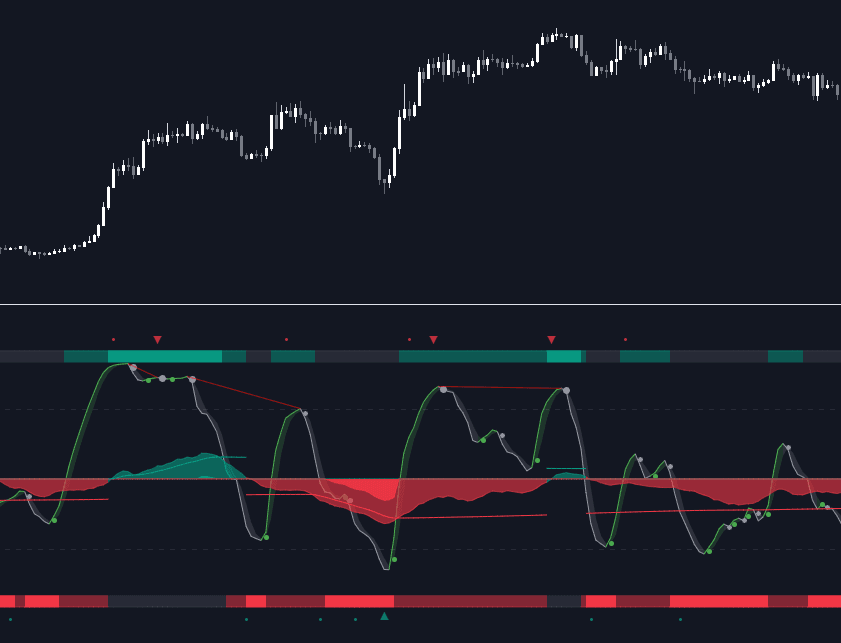
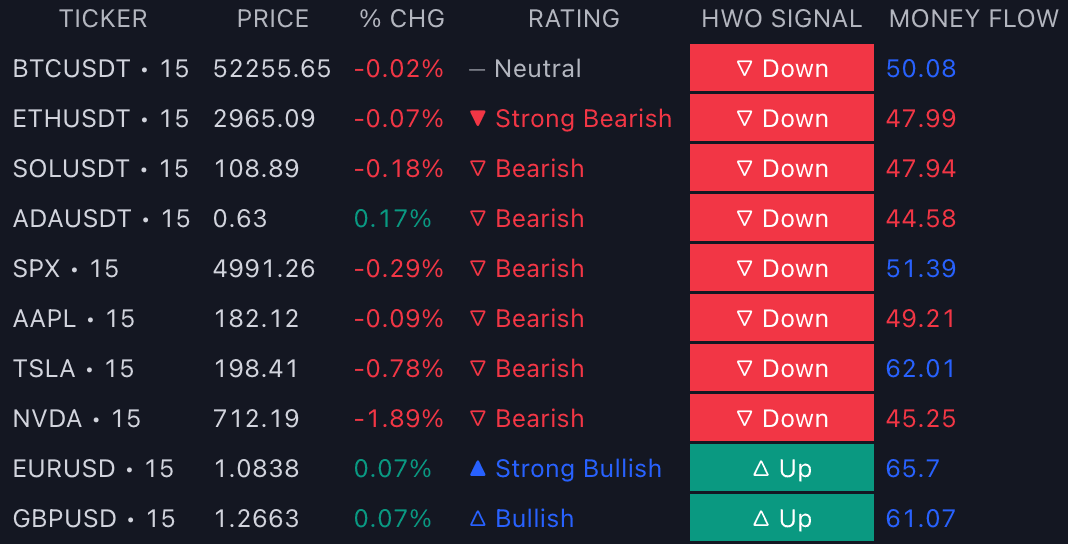
The standard Money Flow Index indicator
Money Flow Index exactly as classically defined: the faithful reference build of the original formula, free to run in Quant.
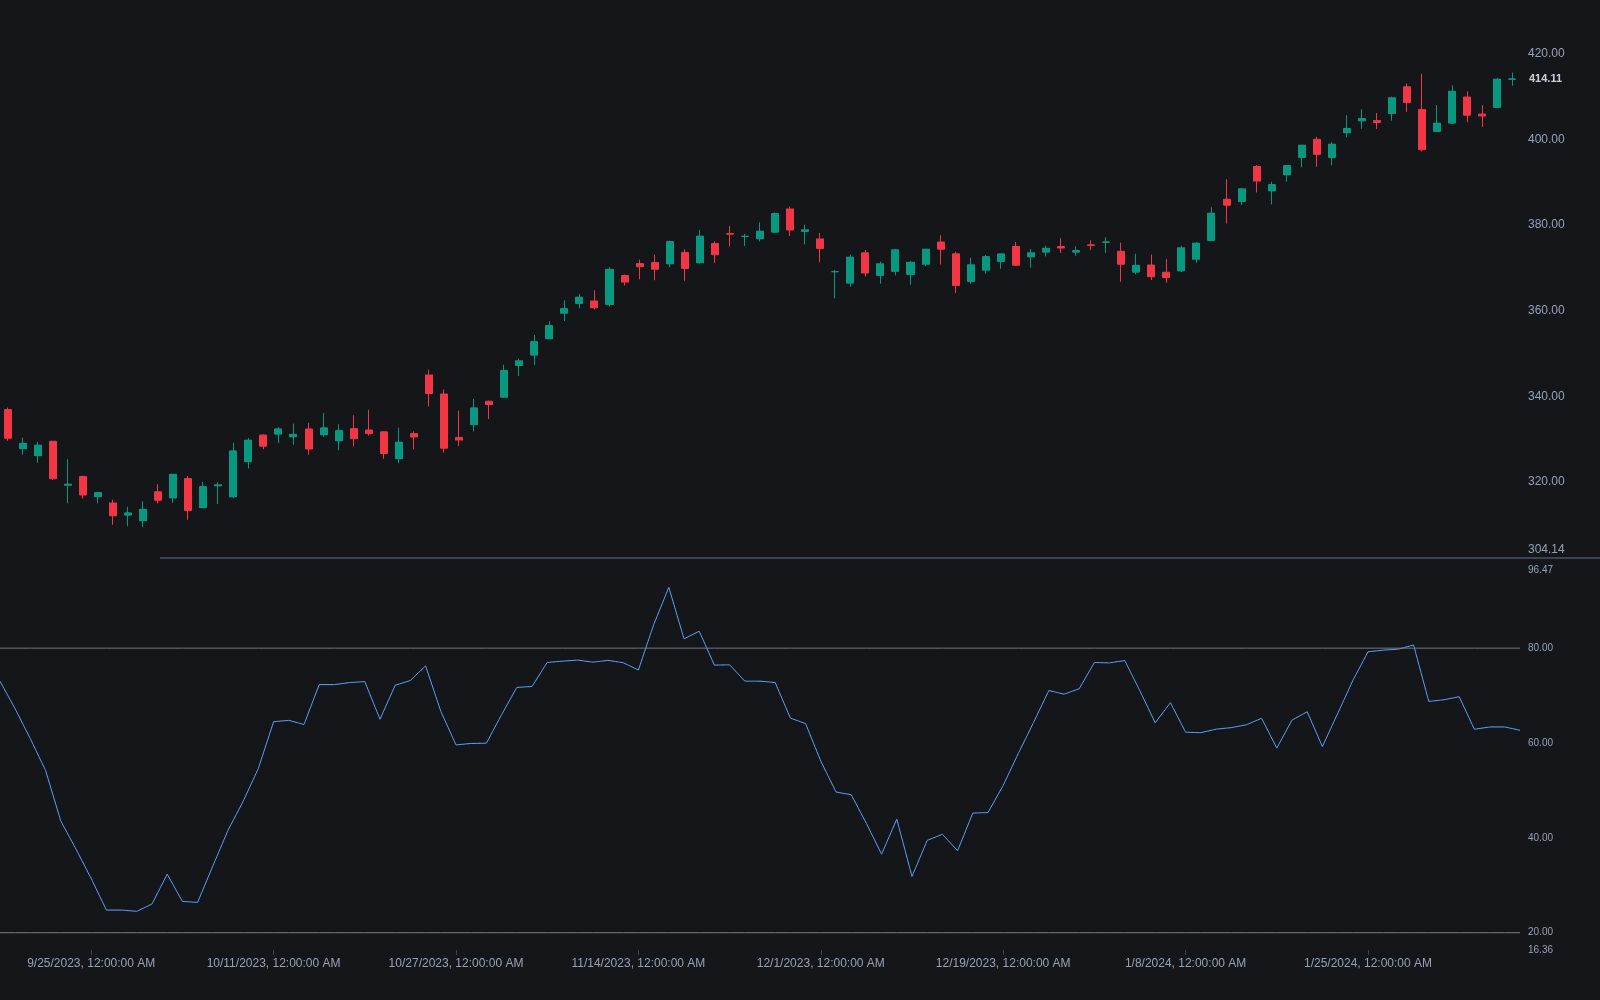
What is the Money Flow Index?
The Money Flow Index (MFI) is a volume-weighted momentum oscillator bounded between 0 and 100, developed by Gene Quong and Avrum Soudack and often described as a volume-weighted RSI. Each bar's typical price, the average of high, low, and close, is multiplied by volume to give raw money flow. Bars where typical price rose versus the prior bar contribute positive money flow, bars where it fell contribute negative money flow, and unchanged bars are skipped. Over the lookback (14 periods by default) the positive sum is divided by the negative sum to form the money flow ratio, and MFI equals 100 minus 100 divided by (1 plus that ratio).
Conventional reading places the overbought/oversold thresholds at 80 and 20, set wider than RSI's customary 70/30. Divergences carry particular weight: a price high that MFI fails to confirm says the balance of dollar-weighted flow behind the advance was weaker than on the previous push. Because volume scales the calculation, MFI and RSI can disagree on the same chart, and that disagreement is itself information about participation.
The indicator matters because it folds participation into momentum: a rally on heavy volume registers differently from an identical rally on thin volume, a distinction pure price oscillators cannot make. The usual oscillator caveats apply in full. In strong trends MFI can stay pinned beyond 80 or 20 for extended stretches, so an extreme reading is a condition to monitor, not a standalone signal to fade.
How to calculate the Money Flow Index
The standard 14-period construction, following Quong and Soudack's original design.
- 1Compute each bar's typical price, (high + low + close) / 3, and multiply it by the bar's volume to get raw money flow.
- 2Classify the bar: if typical price is above the prior bar's, its money flow is positive; if below, negative; if equal, the bar is skipped.
- 3Sum positive and negative money flow separately over the lookback, 14 bars by default, and divide the positive sum by the negative sum to form the money flow ratio.
- 4Convert to the index: MFI = 100 - 100 / (1 + money flow ratio). Readings run 0 to 100, with 80 and 20 the conventional extreme thresholds.
How it's calculated
A volume-weighted momentum oscillator on a 0 to 100 scale that measures buying versus selling pressure from typical price and volume.
Equivalently MFI = 100 × PosMF / (PosMF + NegMF), which also handles the NegMF = 0 case.
Bars with an unchanged typical price add to neither sum.
Common bands are 80 overbought and 20 oversold; developed by Gene Quong and Avrum Soudack.
How traders use it
- For overbought/oversold mean reversion in ranging markets: excursions beyond 80 or 20 that curl back toward the midline flag fading opportunities, ideally with a trend/range classifier first deciding whether fading is appropriate at all.
- For divergence analysis: price making a new extreme while MFI makes a lesser one is a classic regular divergence with an added claim, namely that dollar-weighted participation, not just momentum, failed to confirm.
- For breakout and trend confirmation: MFI pushing to new highs alongside price argues volume is sponsoring the move, whereas a flat MFI during a rally warns the advance is thin.
- For failure swings borrowed from Wilder's RSI playbook: an MFI that exceeds 80, pulls back, fails to regain the prior peak, and then breaks its interim low completes a bearish failure swing, mirrored on the buy side below 20.
Money Flow Index vs other volume-flow tools
RSI: RSI runs a similar bounded-ratio normalization on price change alone, using Wilder's smoothing where MFI uses simple sums. MFI weights each bar by typical price times volume, so the two part ways when volume is lopsided, and MFI conventionally uses 80/20 rather than 70/30 thresholds.
OBV: OBV is an unbounded running total that adds or subtracts each bar's full volume by close direction. MFI is a bounded 0-100 oscillator over a fixed window, so OBV shows cumulative flow while MFI shows recent flow pressure.
Accumulation/Distribution Line: The A/D line weights volume by where the close sits within the bar's range and accumulates indefinitely. MFI classifies whole bars as positive or negative by typical-price direction and normalizes the result into an oscillator.
Twiggs Money Flow: Twiggs Money Flow smooths a close-location-weighted volume measure into a ratio that oscillates around zero. MFI instead ratios positive against negative typical-price money flow and is read against 80/20 extremes.
Concept family
Volume & Order Flow
88 concepts mapped · 88 in the Library
Money Flow Index FAQ
Turn Money Flow Index into a trading strategy.
Take any implementation from this page into Quant, then build on it, backtest it on real data, and keep refining it in conversation.