Parabolic SAR
 By LuxAlgoApr 13, 2020
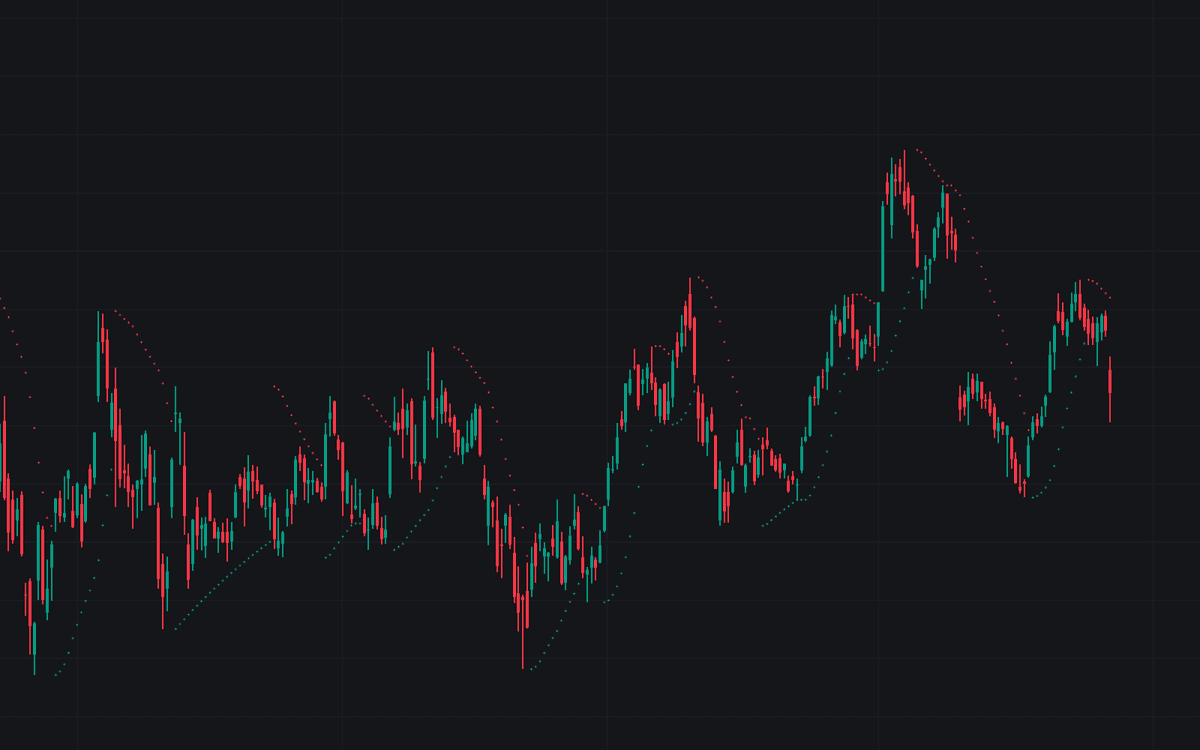

The Parabolic SAR plots a series of dots that trail price (below the bars in uptrends, above them in downtrends) accelerating toward the market as a trend extends and flipping to the opposite side when price crosses them. The name abbreviates "stop and reverse": each dot is both trailing stop and the level where the trend is declared finished. This build is the raw textbook implementation using Wilder's standard parameters: a starting acceleration factor of 0.02, an increment of 0.02, and a maximum of 0.2.
How to Trade the Parabolic SAR?
- SAR below price: the system is long; each dot marks the rising trailing stop for the uptrend.
- SAR above price: the system is short, trailing the downtrend from above.
- Bullish flip: the SAR crosses under price and restarts below the market, a new uptrend by this system's definition.
- Bearish flip: the SAR crosses over price, stopping the uptrend out.
- Dots tightening toward price: the trend keeps printing new extremes, so the exit level is closing in quickly.
Every flip is at once an exit and a reversal signal: an asset in sustained trends, a liability in ranges. Alert conditions are included for both the bullish and the bearish flip.
Parabolic SAR Settings
- Start (default 0.02): the initial acceleration factor applied when a new trend begins. Raising it starts the dots closer to price for earlier exits at the cost of premature flips.
- Increment (default 0.02): the amount added to the acceleration factor each time the trend makes a new extreme point. Larger values tighten the trail faster in strong moves.
- Maximum (default 0.2): the upper cap on the acceleration factor. Lowering it keeps the trail looser late in a trend, holding positions longer but giving back more at the reversal.
Frequently Asked Questions

The Library is free. Quant makes it yours.
Pull any concept or indicator into Quant: rebuild it, retune it, or turn it into a backtested strategy of your own.