Concept
Parabolic SAR
Parabolic SAR is a Trend concept. The Library holds 2 implementations, each one a working definition you can pull into Quant.
Top Parabolic SAR indicator
The top custom implementation, built on the original standard Parabolic SAR formula.
2 total
Any of the 2 Parabolic SAR implementations below can become a backtested trading strategy — describe your rules and Quant writes the code.
.png&w=3840&q=75)
The standard Parabolic SAR indicator
Parabolic SAR exactly as classically defined: the faithful reference build of the original formula, free to run in Quant.
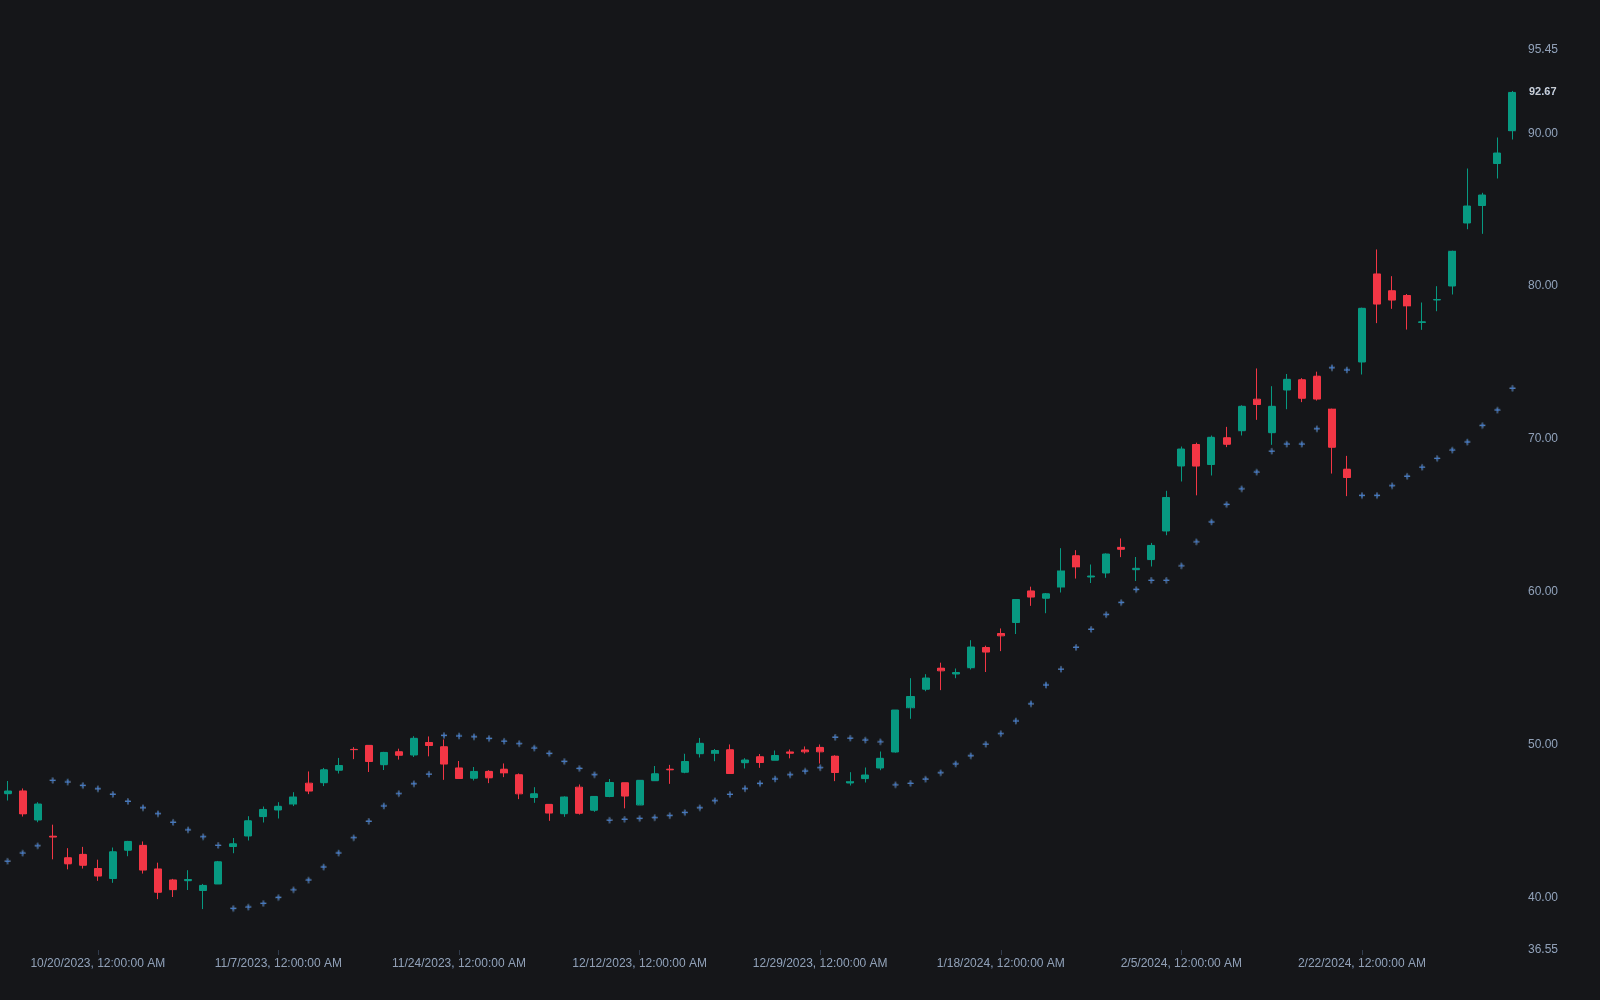
What is the Parabolic SAR?
The Parabolic SAR (stop and reverse) is a trailing stop system introduced by J. Welles Wilder in his 1978 book New Concepts in Technical Trading Systems. It plots one dot per bar: below price while the system is long, above price while it is short. Each bar the dot advances toward price by an acceleration factor (AF) times the distance between the trend's extreme point and the current SAR. The AF starts at 0.02, increases by 0.02 each time the trend prints a new extreme, and caps at 0.20; that accelerating step is what bends the trail into its parabola.
When price touches the dot, the system stops and reverses: the SAR flips to the other side, restarting at the prior extreme with the AF reset. By construction it is always in the market, which makes it a stop-placement method as much as a signal generator. It behaves well in sustained trends, tightening as the move accelerates, and poorly in ranges, where it flips repeatedly. Wilder himself positioned it as a tool for trending markets and pointed to his ADX/DMI system as the filter for deciding when to run it.
How to read Parabolic SAR
The plot is a dotted trail that switches sides of price. To read it:
- 1Check which side the dots are on: below price marks an uptrend regime (system long), above price a downtrend regime (system short).
- 2Watch the gap between dot and price: dots accelerating toward price mean the trend keeps printing new extremes and the trailing stop is tightening.
- 3Treat a touch as a flip: the dots jump to the opposite side at the prior extreme, and the acceleration count restarts at its minimum.
- 4Grade flips by context: in a trending tape a flip is meaningful, while in sideways chop flips fire constantly and most fail, so require a higher-timeframe trend filter or an ADX-style gate first.
How it's calculated
Parabolic SAR trails price with a stop-and-reverse level that accelerates toward the trend's extreme and flips sides when price touches it.
Wilder's defaults are 0.02 step and 0.2 maximum; a larger step tightens the stop, a larger cap lets it accelerate longer.
The first SAR must be seeded from an assumed starting trend and its extreme, so early values differ slightly across platforms.
How traders use it
- As a trailing stop for open positions, its original job: the dot is the exit level, and it only ratchets in the trade's favor. The broader trailing method taxonomy shows where it sits among alternatives.
- As an always-in stop-and-reverse system, flipping long and short on every touch; usually only viable with a regime filter screening out ranges.
- As a one-glance trend read for dashboards and multi-symbol screens: which side the dots sit on is a compact regime label.
- As a time-based tightening template: the SAR keeps stepping toward price every bar even when no new extreme prints, so it closes out stalls sooner than fixed-distance volatility stops, which suits traders who want stagnant trades closed.
Parabolic SAR vs other trailing systems
Supertrend: Both are flip-on-touch trailing systems. Supertrend offsets its stop by a multiple of ATR, so the distance scales with volatility; the SAR's distance shrinks with time and new extremes regardless of volatility, so it tightens even when the market goes quiet.
Chandelier Stop: The chandelier trails an ATR multiple from the extreme high or low and is a stop only. The SAR is a full stop-and-reverse system that is always positioned, with tightening driven by acceleration rather than a fixed ATR multiple.
Stop and Reverse: Stop and reverse is the general always-in concept: every exit is also the next entry. The Parabolic SAR is its most famous concrete implementation, with Wilder's acceleration schedule deciding where the reversal point sits.
Concept family
Trend
100 concepts mapped · 100 in the Library
Parabolic SAR FAQ
Turn Parabolic SAR into a trading strategy.
Take any implementation from this page into Quant, then build on it, backtest it on real data, and keep refining it in conversation.