Pivot Points Standard
 By LuxAlgoApr 13, 2020
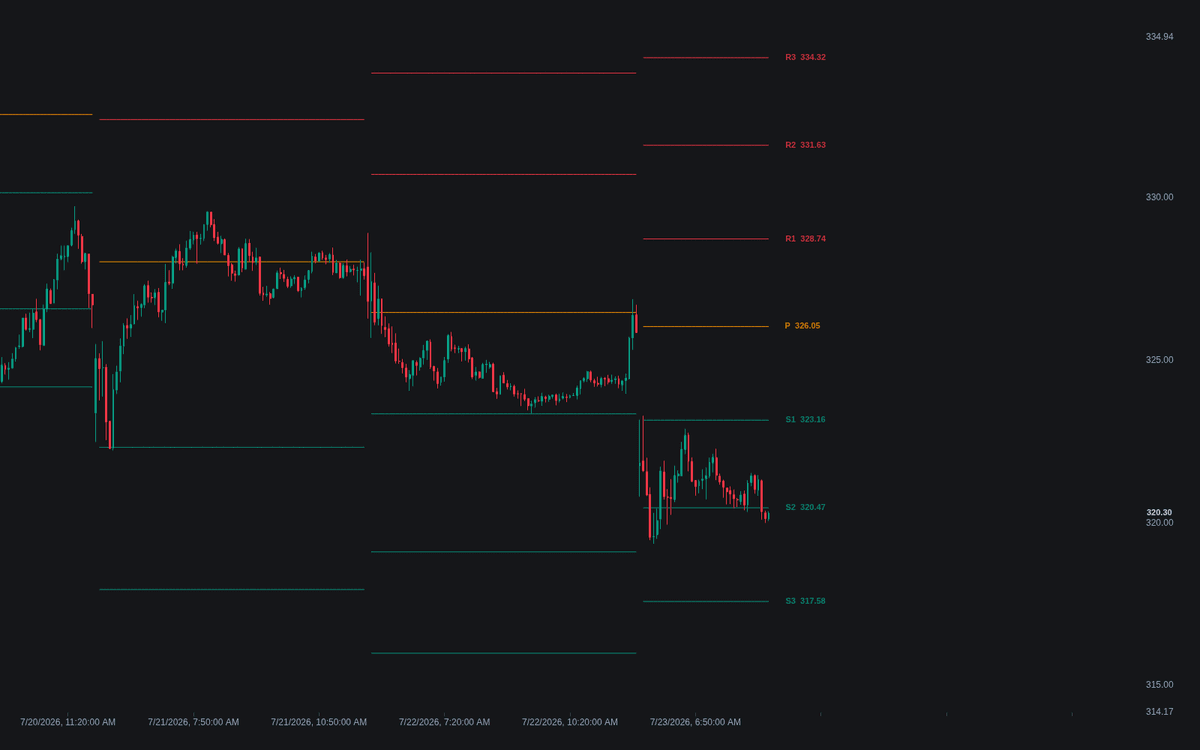

Pivot Points Standard calculates a central pivot level from the prior period's high, low, and close, then plots the derived support and resistance levels above and below it, a ladder fixed the moment the prior period ends. A type selector chooses the formula set, Traditional by default with Fibonacci, Camarilla, and Woodie options, and the pivot timeframe is chosen automatically from the chart resolution. This is the standard pivot points implementation with no proprietary additions.
The chart shows the central pivot P with resistances R1-R4 above and supports S1-S4 below, drawn as flat segments that break and re-anchor at each new period. Traditional and Fibonacci plot three rungs per side, Camarilla four, and Woodie two.
How to Trade the Pivot Points Standard?
- Price above P: the period leans bullish, with the pivot as first support on pullbacks.
- Price below P: bearish, with P as overhead resistance on rallies.
- Tests of R1-R3 and S1-S3: natural places to expect reactions (scaling out into resistance rungs, dip buying or covering at supports).
- Acceptance beyond R1 or S1: holding past the first rung marks a trending period; deeper rungs become the objectives.
Treat each rung as a spot to watch for a reaction, not a price that owes you one. Alerts are included for price crossing the pivot, R1, and S1.
Pivot Points Standard Settings
- Type (default Traditional): Traditional averages the prior high, low, and close into the pivot and reflects the prior range around it; Fibonacci projects 38.2%, 61.8%, and 100% of the prior range from the pivot; Camarilla scales 1.1 times the prior range around the prior close and adds an R4/S4 pair; Woodie gives extra weight to the current period's open.
- Pivots Timeframe (default Auto): the anchor period, picked from the chart resolution on Auto, or pinned to Daily, Weekly, Monthly, or Yearly.
Frequently Asked Questions

The Library is free. Quant makes it yours.
Pull any concept or indicator into Quant: rebuild it, retune it, or turn it into a backtested strategy of your own.