Concept
Pivot Points
Pivot Points, also known as floor trader pivots, standard pivot points, camarilla, woodie, are Support/Resistance & Levels concepts. The Library holds 2 implementations, each one a working definition you can pull into Quant.
Top Pivot Points indicator
The top custom implementation, built on the original standard Pivot Points formula.
2 total
Want to trade Pivot Points? Any of the 2 implementations below is one prompt away from a backtested strategy in Quant.
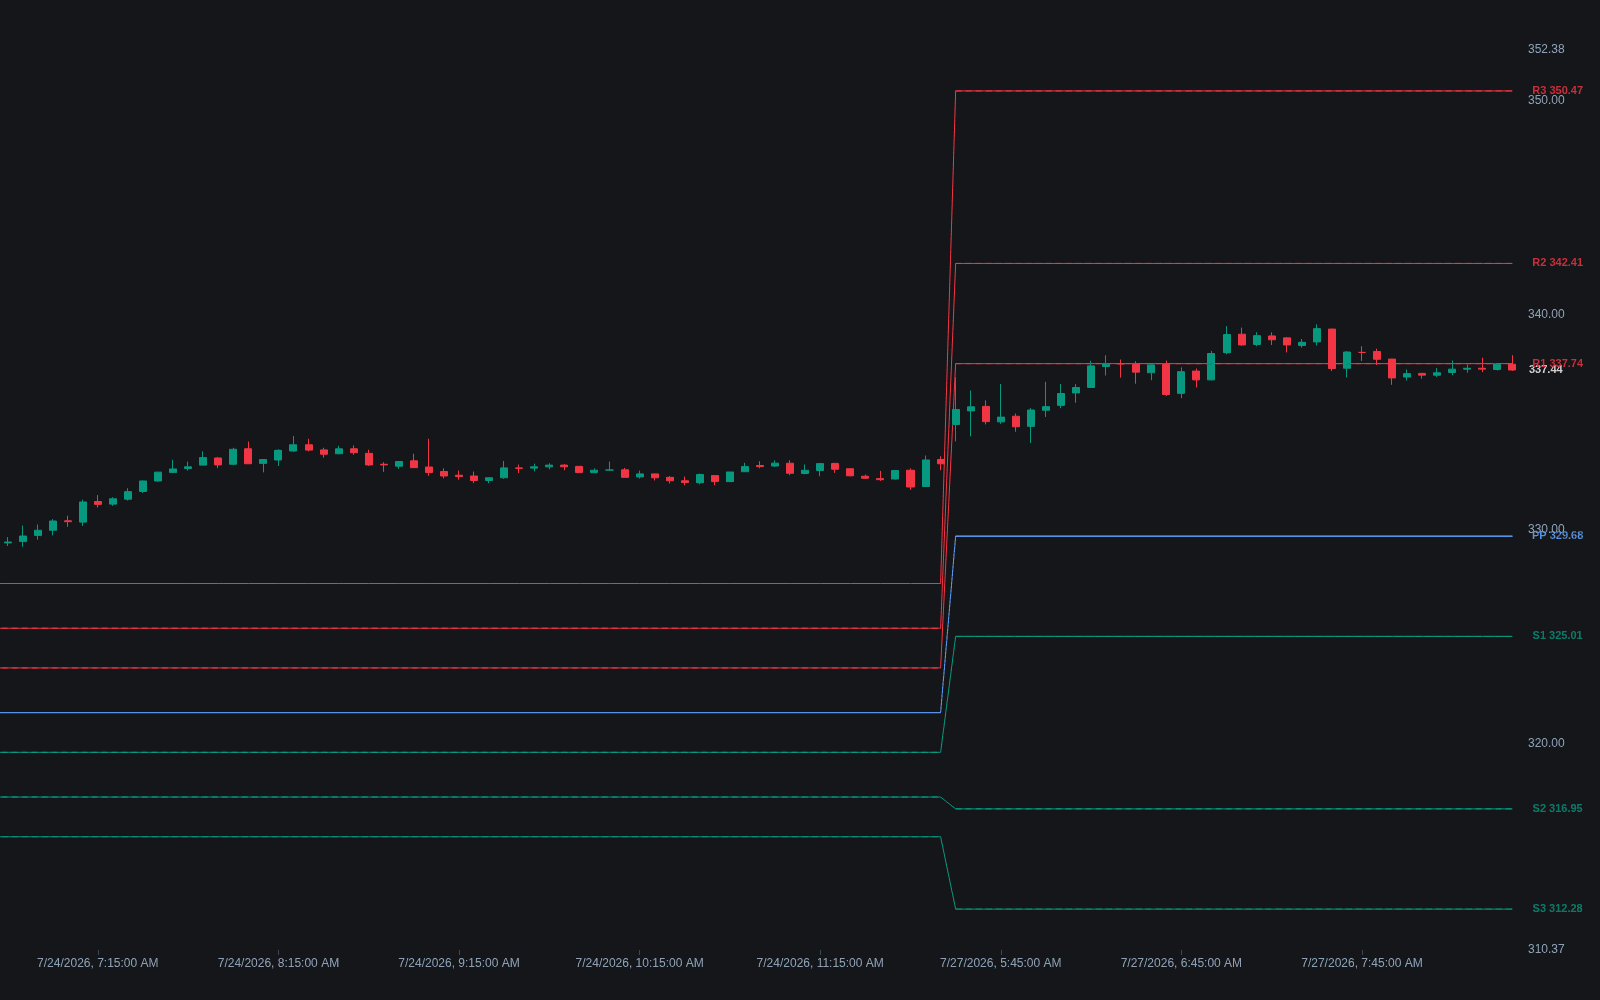
The standard Pivot Points indicator
Pivot Points exactly as classically defined: the faithful reference build of the original formula, free to run in Quant.
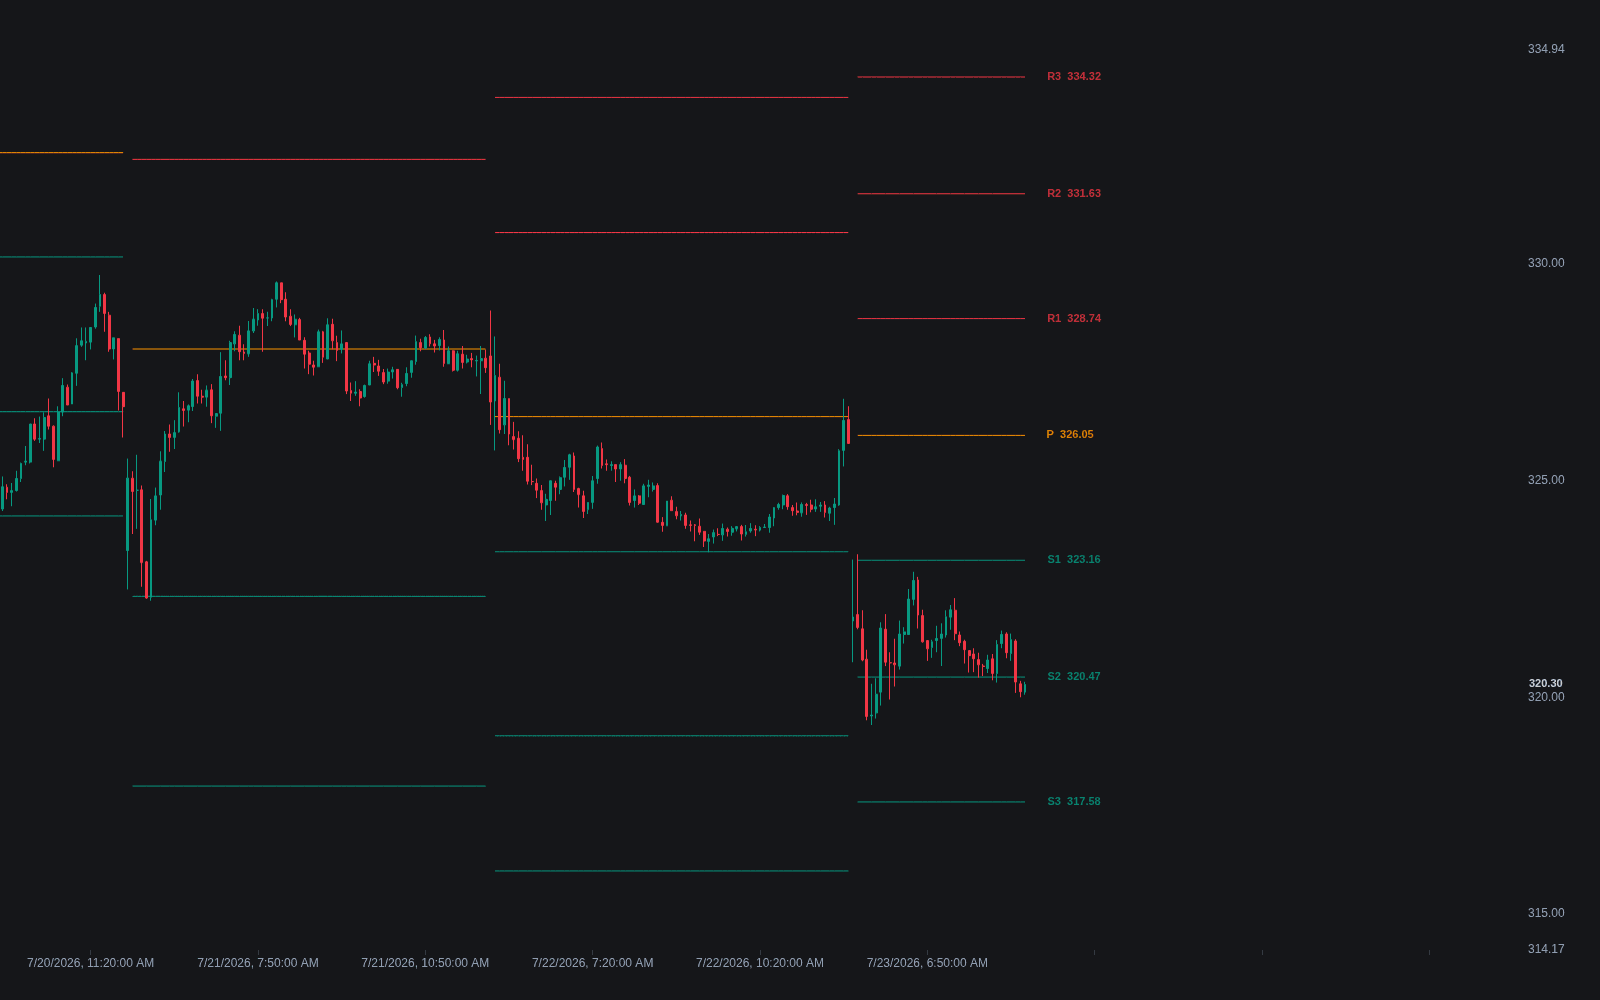
What are Pivot Points?
Pivot points are formula-derived support and resistance levels computed from the prior period's price data (usually the high, low, and close) and projected onto the current session before it opens. The original version, often called floor trader pivots or standard pivot points, comes from the pit-trading era, when floor traders needed likely reference prices for the day without access to charts. A central pivot averages the prior session's range and close, and a ladder of support and resistance rungs is reflected around it.
The idea grew into a family of systems that keep the projection logic but change the arithmetic: floor pivots, Camarilla, Woodie pivots, Fibonacci pivots, and DeMark pivots all take the same inputs and emit different ladders. This page is the umbrella for the family; each system has its own entry with its exact formulas and conventions.
Traders care about pivots for two reasons. First, they are objective: everyone who computes them from the same session data gets the same lines, which removes the discretion involved in drawing levels by eye. Second, because they are widely watched, they can act as partly self-fulfilling references, with orders and reactions gathering near them. That said, pivots are arithmetic projections, not prices where trading necessarily occurred, so they earn respect only to the extent price actually reacts to them.
How it's calculated
The classic floor-trader form is the reference implementation; variant systems replace these formulas with their own.
The period can be daily, weekly, or monthly; longer anchors produce slower-moving levels.
Session definition matters: computing from the full 24-hour session versus regular hours yields different levels on futures and forex.
How traders use it
- As a pre-session map: intraday traders mark the pivot ladder before the open and watch how the first tests of PP, R1, and S1 resolve, treating reactions there like tests of any prior period level.
- As a directional bias filter: trading above the central pivot is often read as an intraday bullish lean and below it as bearish, though this is a coarse filter rather than a signal on its own.
- As profit-target scaffolding: a long from S1 might target PP or R1, giving predefined exits without waiting for structure to form.
- In confluence work: a pivot that lands on top of an independently derived reference, such as a volume node or round number, is generally weighted more than one sitting alone in space.
- With honest expectations: on trending days price can slice through the entire ladder, so pivots work best paired with a regime read rather than faded mechanically.
Pivot points vs related level frameworks
Floor Pivots: Floor pivots are the specific classic system described above; pivot points is the umbrella term covering that system plus Camarilla, Woodie, Fibonacci, and DeMark variants.
Central Pivot Range: The central pivot range extends the single PP into a three-line zone (pivot, top central, bottom central) and emphasizes the width of that zone as a volatility and bias cue.
Prior Period Levels: Prior highs, lows, and closes are actual traded prices; pivot rungs are arithmetic projections that may sit where nothing ever traded. Many traders trust the former more and use pivots as secondary references.
Concept family
Support/Resistance & Levels
38 concepts mapped · 38 in the Library
Pivot Points FAQ
Turn Pivot Points into a trading strategy.
Take any implementation from this page into Quant, then build on it, backtest it on real data, and keep refining it in conversation.