Price Oscillator
 By LuxAlgoApr 13, 2020
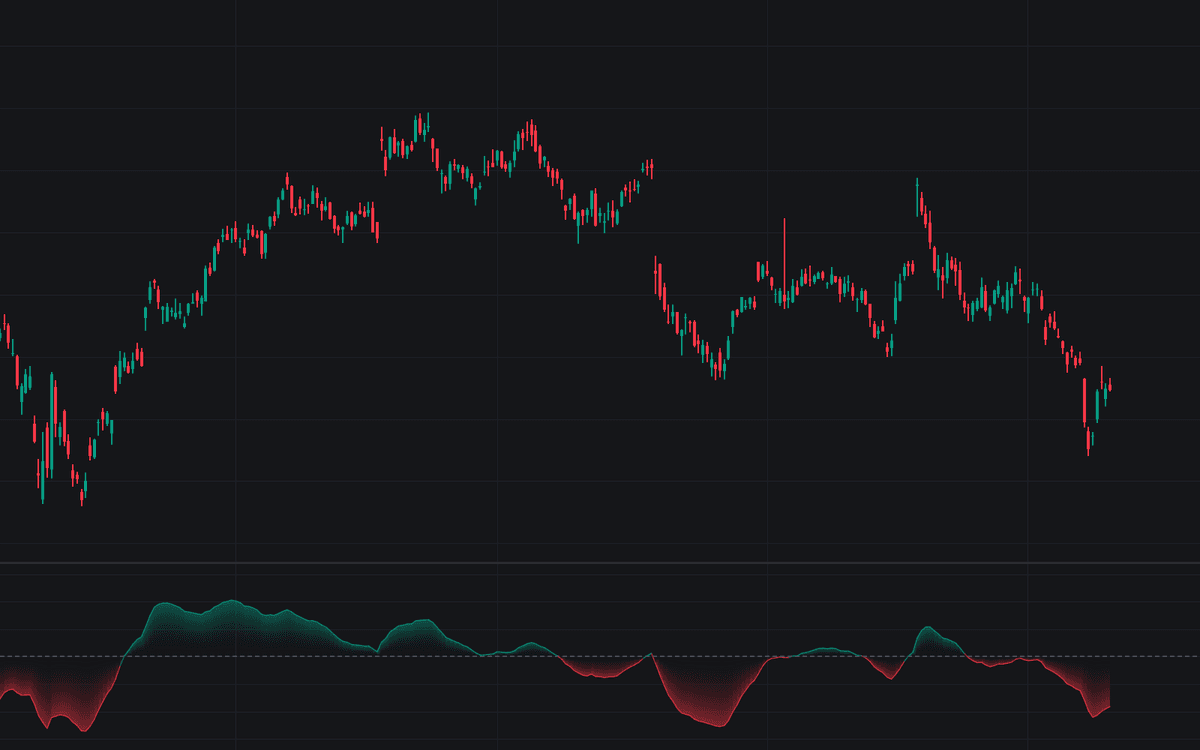

The Price Oscillator tracks the gap between a fast and a slow exponential moving average and plots it as a single line swinging around zero, turning the familiar moving average crossover into a momentum reading traders can track bar by bar. A mode input expresses the difference either as a percentage of the slow average (the PPO, and the default) or as an absolute difference in price units, the APO. With the classic 12/26 lengths, every crossing of the zero line lands on the exact bar where the two EMAs cross on the price chart. This is an unembellished implementation of the standard formula.
How to Trade the Price Oscillator?
- Sign: above zero the fast EMA is above the slow EMA and the crossover state favors the upside; below zero is the bearish regime.
- Zero crosses: the bullish or bearish moving average crossover, expressed as an oscillator event; alerts are included for both directions.
- Slope changes: a rising line means the spread is widening; rolling over toward zero warns the move is fading before any cross prints.
- Divergence: a new price extreme on a smaller oscillator swing questions the move's strength.
The zero line is drawn as a dashed reference in the pane.
Price Oscillator Settings
- Fast Length (default 12): the length of the fast EMA. Shortening it makes the oscillator react sooner and whipsaw more often.
- Slow Length (default 26): the length of the slow EMA the fast one is measured against. Lengthening it slows the zero crosses and filters minor swings.
- Source (default close): the price series both EMAs are calculated on.
- Mode (default Percentage): Percentage plots 100 * (fast EMA - slow EMA) / slow EMA; Absolute plots the raw difference in price units.
Frequently Asked Questions

The Library is free. Quant makes it yours.
Pull any concept or indicator into Quant: rebuild it, retune it, or turn it into a backtested strategy of your own.