Concept
APO
APO, also known as absolute price oscillator, is a Momentum & Oscillators concept. The Library holds 1 implementation, a working definition you can pull into Quant.
The standard APO indicator
APO exactly as classically defined: the faithful reference build of the original formula, free to run in Quant.
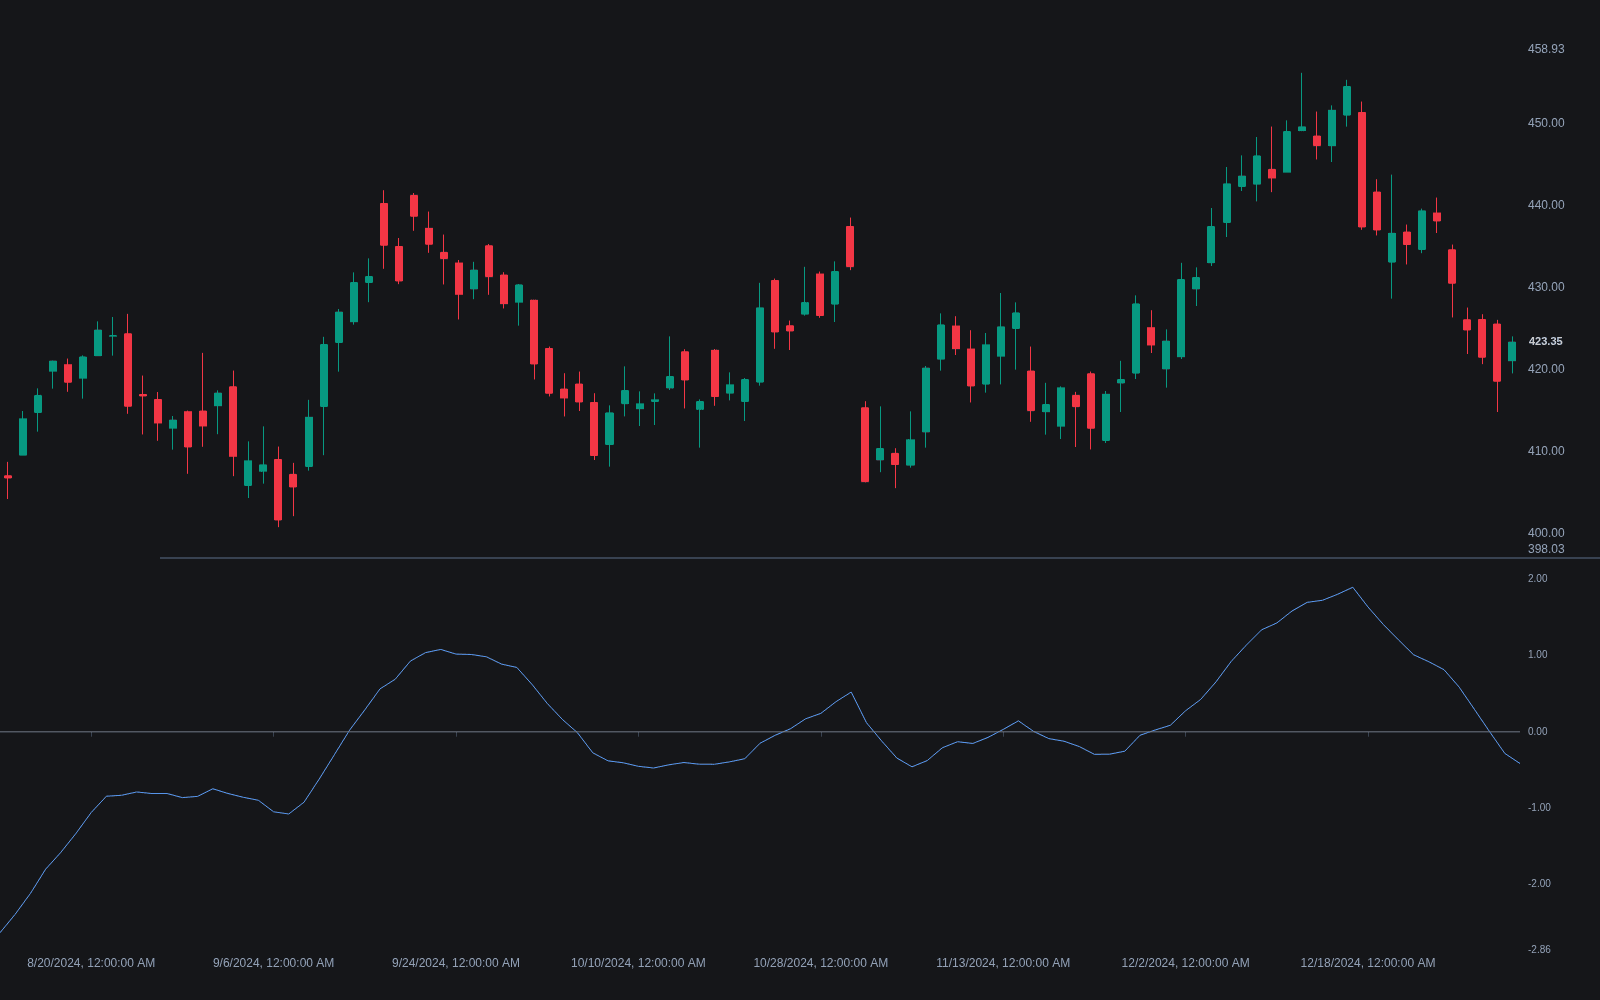
What is APO?
APO, the Absolute Price Oscillator, is the difference between a fast and a slow moving average of price, plotted around zero and denominated in price units (dollars, points, pips). With the standard 12- and 26-period exponential averages it is identical to the MACD line; APO is that line generalized to arbitrary lengths and usually shown without MACD's signal line and histogram. Positive readings mean the fast average is above the slow one, and the zero cross is exactly a moving average crossover expressed as an oscillator.
There is no single credited inventor: subtracting a slow average from a fast one is among the oldest oscillator constructions in technical analysis, and APO is simply the name that standard indicator libraries gave the raw difference. Platforms differ on details, most commonly whether the averages are exponential or simple, so two charts labeled APO can disagree slightly on the same data. What every version shares is the unit: the reading is a price spread, not a percentage or a normalized score.
Because the difference is absolute, APO's magnitude scales with the instrument's price level: a reading of 5 is enormous on a $50 stock and trivial on an index at 20,000, and the same chart's readings from years ago stop being comparable after a large price change. That makes APO suitable for one instrument over a reasonably stable window, and PPO, the percentage version, the right tool for comparisons.
The oscillator's value is its directness. It states, in tradable units, how far the short-run consensus has pulled away from the long-run one. That number feeds three distinct reads: its sign tracks the crossover state, its slope tracks whether momentum is building or fading, and its swing extremes relative to price set up divergence analysis. The cost of that directness is the missing context a bounded tool provides: nothing in APO itself says a reading is extreme, so overbought/oversold judgments need either the instrument's own history or a companion oscillator.
How to read APO on a chart
APO plots in its own pane around a zero line, and each of its features maps back to the two averages that built it.
- 1Add APO with your chosen fast and slow lengths (12 and 26 are the common defaults) and note whether your platform uses exponential or simple averages.
- 2Read the sign first: above zero the fast average is above the slow one, the state a chart-overlay crossover would show; below zero is the mirror.
- 3Read the slope next: rising bars or line segments mean the fast average is pulling away upward, momentum building; a rollover toward zero means the spread is closing.
- 4Compare APO's swing extremes with price's swings: price making a new extreme that APO fails to match is the setup examined under regular bullish/bearish divergence.
- 5Before comparing today's readings with older ones, check that the instrument's price level has been reasonably stable across the window, because APO's scale drifts with price.
How it's calculated
Momentum as the difference, in price units, between a fast and a slow EMA of the same source.
With the same lengths, APO equals the MACD line; PPO expresses the same spread as a percentage.
Because the output is in price units it is not comparable across differently priced symbols.
Some platforms offer SMA smoothing in place of the EMAs.
How traders use it
- As a single-instrument momentum gauge: position above or below zero tracks the moving average relationship, and slope changes flag momentum building or fading, with the zero cross as the mechanical crossover signal.
- As a stretch measure in price units: APO directly states how far the fast average is extended from the slow one in ticks or dollars, which some mean-reversion rules threshold explicitly.
- As configurable raw material: divergence checks, smoothing, or histogram-style differencing on APO reproduce much of the MACD toolkit with freely chosen lengths.
- As a divergence input: swing highs and lows in APO are compared against price extremes for regular and hidden divergence reads, with the usual demand for confirmation before acting.
- As a companion to bounded oscillators: pairing APO's raw spread with a bounded tool such as RSI or the Stochastic Oscillator supplies the extreme-reading context APO alone cannot give.
APO vs related momentum tools
MACD: With 12/26 EMAs the two lines are the same number; MACD packages it with a 9-period signal line and histogram, while APO ships bare and freely re-parameterized. Choose by whether you want the extra crossing machinery.
ROC: ROC compares price with its own value n bars ago, so it measures raw change with no smoothing and reacts bar by bar. APO compares two smoothed consensuses, trading immediacy for stability.
CCI: CCI measures deviation from an average scaled by typical deviation, so its readings are roughly normalized and support fixed thresholds like 100. APO stays in raw price units, so thresholds must come from the instrument's own history.
Concept family
Momentum & Oscillators
91 concepts mapped · 91 in the Library
APO FAQ
Turn APO into a trading strategy.
Take the implementation from this page into Quant, then build on it, backtest it on real data, and keep refining it in conversation.