Range Breakout Signals (Intrabar)
 By LuxAlgoSep 26, 2023
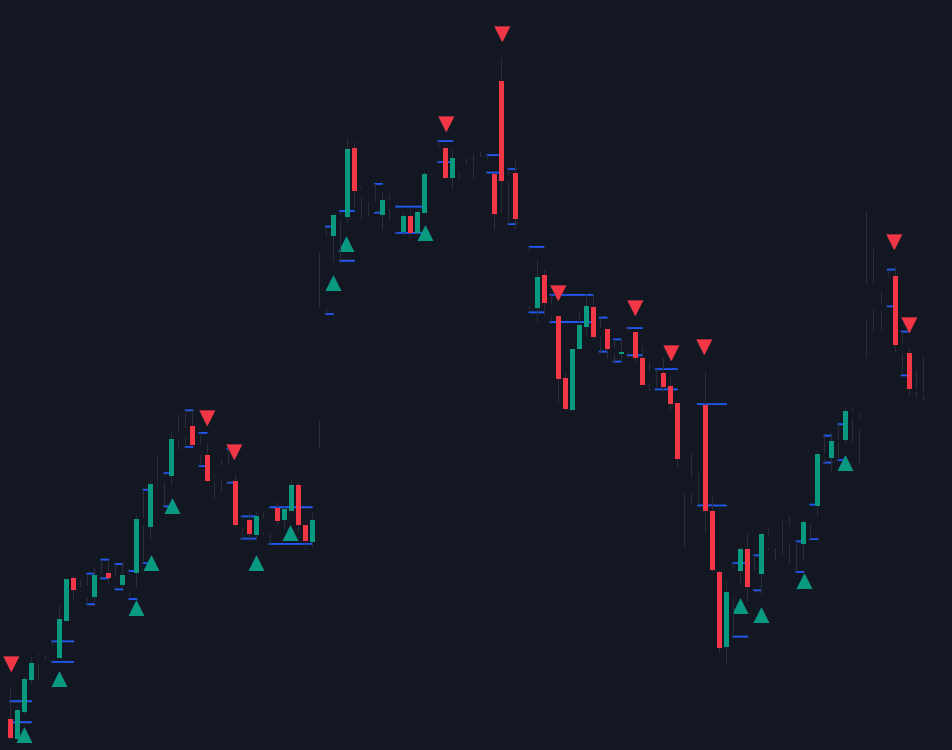
Range Breakout Signals (Intrabar) classifies each chart candle as trending or ranging from its intrabar price action, then signals when price breaks out of a ranging candle's extremities. Trending candles are highlighted green when intrabar prices rose and red when they fell; ranging candles have their bodies concealed so only the high and low remain, the exact levels the signals key off.
How to Trade the Range Breakout Signals (Intrabar)?
- Green / red highlighted candles: intrabar prices trended up or down. Read these as momentum bars rather than signal sources.
- Concealed candle body: intrabar prices are ranging; the remaining upper and lower extremities mark that candle's high and low.
- Breakout signal: fires when price crosses an extremity, with the prevailing move in "Trend Following" mode, or against it in "Reversal" mode to catch early turns.
Under the hood the indicator computes the r-squared of the intrabar data: above 0.5 the candle is treated as trending, below as ranging. The method is close to settings-free: a lower intrabar timeframe simply yields a richer dataset and a more accurate read of each candle's character.
Range Breakout Signals (Intrabar) Settings
- Intrabar Timeframe: the timeframe used to retrieve intrabar data; it must be lower than the chart's own.
- Auto: selects the intrabar timeframe automatically, a convenient default for intraday work.
- Mode: switches signal generation between "Trend Following" and "Reversal".
- Filter Out Successive Signals: removes consecutive signals of the same type for a more readable chart.
Frequently Asked Questions
Free indicator
Get free access to this indicator on the platforms below.

The Library is free. Quant makes it yours.
Pull any concept or indicator into Quant: rebuild it, retune it, or turn it into a backtested strategy of your own.