Relative Strength Index
 By LuxAlgoApr 13, 2020
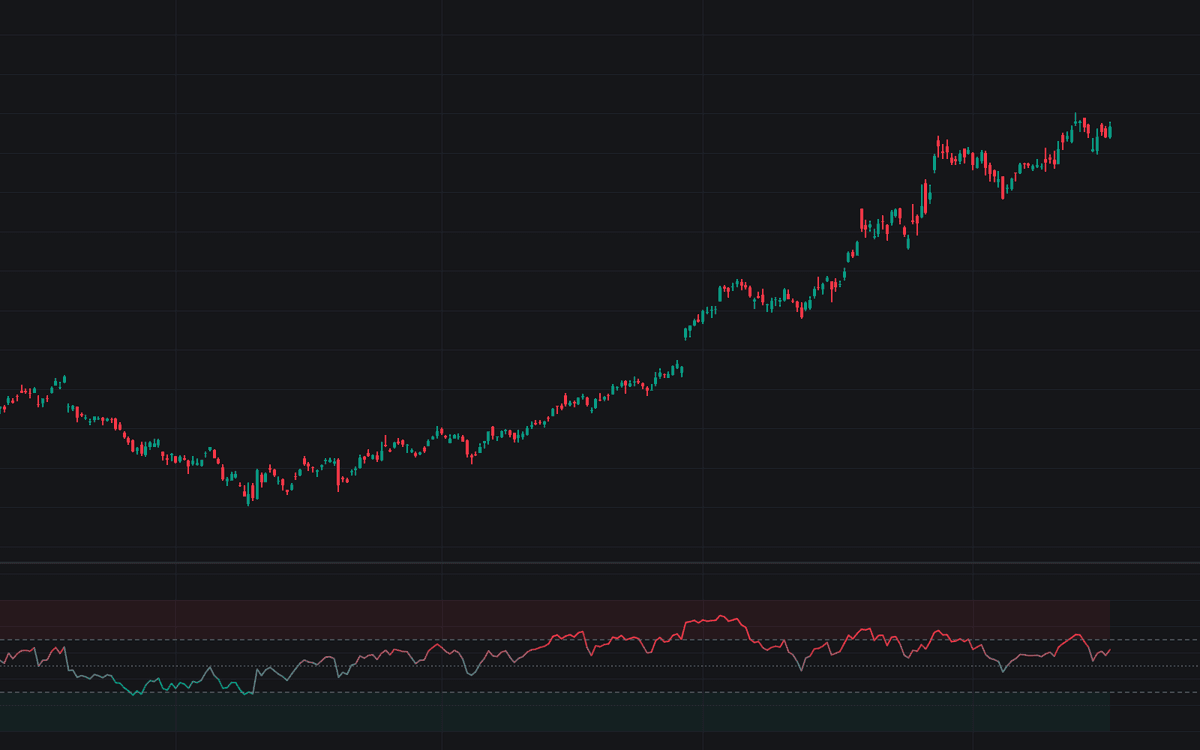

The Relative Strength Index measures the speed and magnitude of recent price changes by comparing average gains to average losses over a lookback window, plotting a bounded oscillator between 0 and 100 used to spot stretched moves, momentum shifts, and divergences. Defaults are a length of 14 on a selectable source with overbought and oversold levels at 70 and 30, the standard raw implementation of Wilder's RSI with the classic settings. The pane draws the RSI line against dashed overbought and oversold levels, a dotted midline at 50, and a shaded band between the thresholds.
How to Trade the Relative Strength Index?
- RSI above 70: overbought, most meaningful as a reversal cue in ranges.
- RSI below 30: oversold, the mirrored read.
- Crosses back inside the band: leaving overbought (back under 70) or oversold (back over 30) is the classic timing trigger, rather than the first touch.
- The 50 midline: momentum favors buyers above it, sellers below.
- Divergence: a new price extreme that RSI refuses to confirm warns the thrust is fading.
Regime matters: strong trends can pin the index near one extreme, so an overbought print in a powerful uptrend is often strength, not a top. Alerts cover all four threshold events: crossing into and back out of both levels.
Relative Strength Index Settings
- Length (default 14): the number of bars used in Wilder's smoothing of average gains and losses. Shorter lengths reach the extremes constantly; longer ones reserve them for unusual moves.
- Source (default close): the price series the RSI is calculated on.
- Overbought (default 70): the level above which the market is considered overbought.
- Oversold (default 30): the level below which the market is considered oversold.
Frequently Asked Questions

The Library is free. Quant makes it yours.
Pull any concept or indicator into Quant: rebuild it, retune it, or turn it into a backtested strategy of your own.