Relative Vigor Index
 By LuxAlgoApr 13, 2020
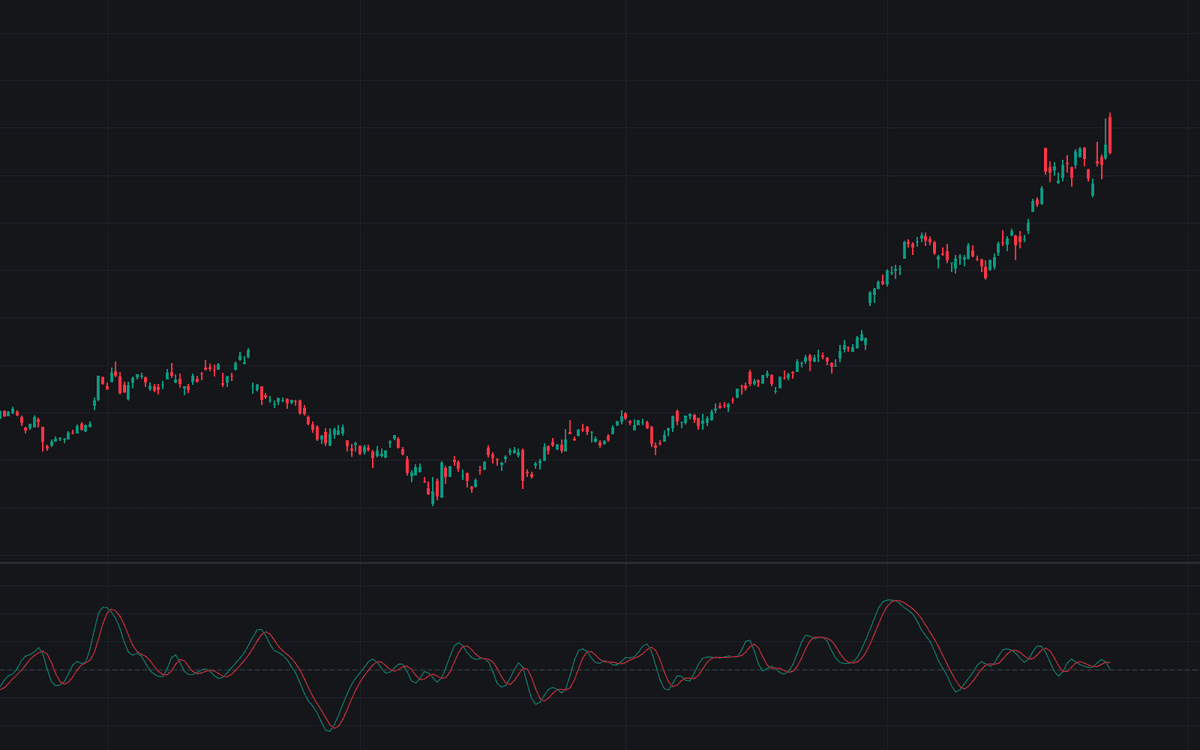

The Relative Vigor Index compares where price closes relative to where it opens, smoothing close-minus-open against high-minus-low over a lookback window so traders can gauge the conviction behind recent bars. This build is the standard raw version: the RVGI line with a default length of 10 and its fixed 4-period symmetrically weighted signal line.
Close-minus-open and high-minus-low each get a 4-bar symmetric weighting, then a sum over the length window before dividing, identical treatment that damps noise while keeping the scale consistent.
How to Trade the Relative Vigor Index?
- RVGI above zero: bars are closing above their opens on balance. Buyers finish the bars in control.
- RVGI below zero: closes are settling under the opens, the bearish condition.
- RVGI crossing above the Signal line: an upturn in vigor; crosses carry more weight when they agree with the prevailing trend.
- RVGI crossing below the Signal line: the downturn read; both crosses are covered by alert conditions.
- Divergence at extremes: a fresh price high against a lower RVGI high says bar-level conviction is fading even as price stretches on.
The line swings around a dashed zero reference with no hard bounds, so what counts as stretched comes from the instrument's recent swings.
Relative Vigor Index Settings
- Length (default 10): the number of bars summed for the smoothed numerator (close minus open) and denominator (high minus low). A longer window produces a slower, steadier line suited to swing reads; a shorter one turns faster and crosses its signal more often. The 4-bar signal smoothing is fixed by the classic construction.
Frequently Asked Questions

The Library is free. Quant makes it yours.
Pull any concept or indicator into Quant: rebuild it, retune it, or turn it into a backtested strategy of your own.