Concept
Relative Vigor Index
Relative Vigor Index is a Momentum & Oscillators concept. The Library holds 1 implementation, a working definition you can pull into Quant.
RVI
The standard Relative Vigor Index indicator
Relative Vigor Index exactly as classically defined: the faithful reference build of the original formula, free to run in Quant.
What is the Relative Vigor Index?
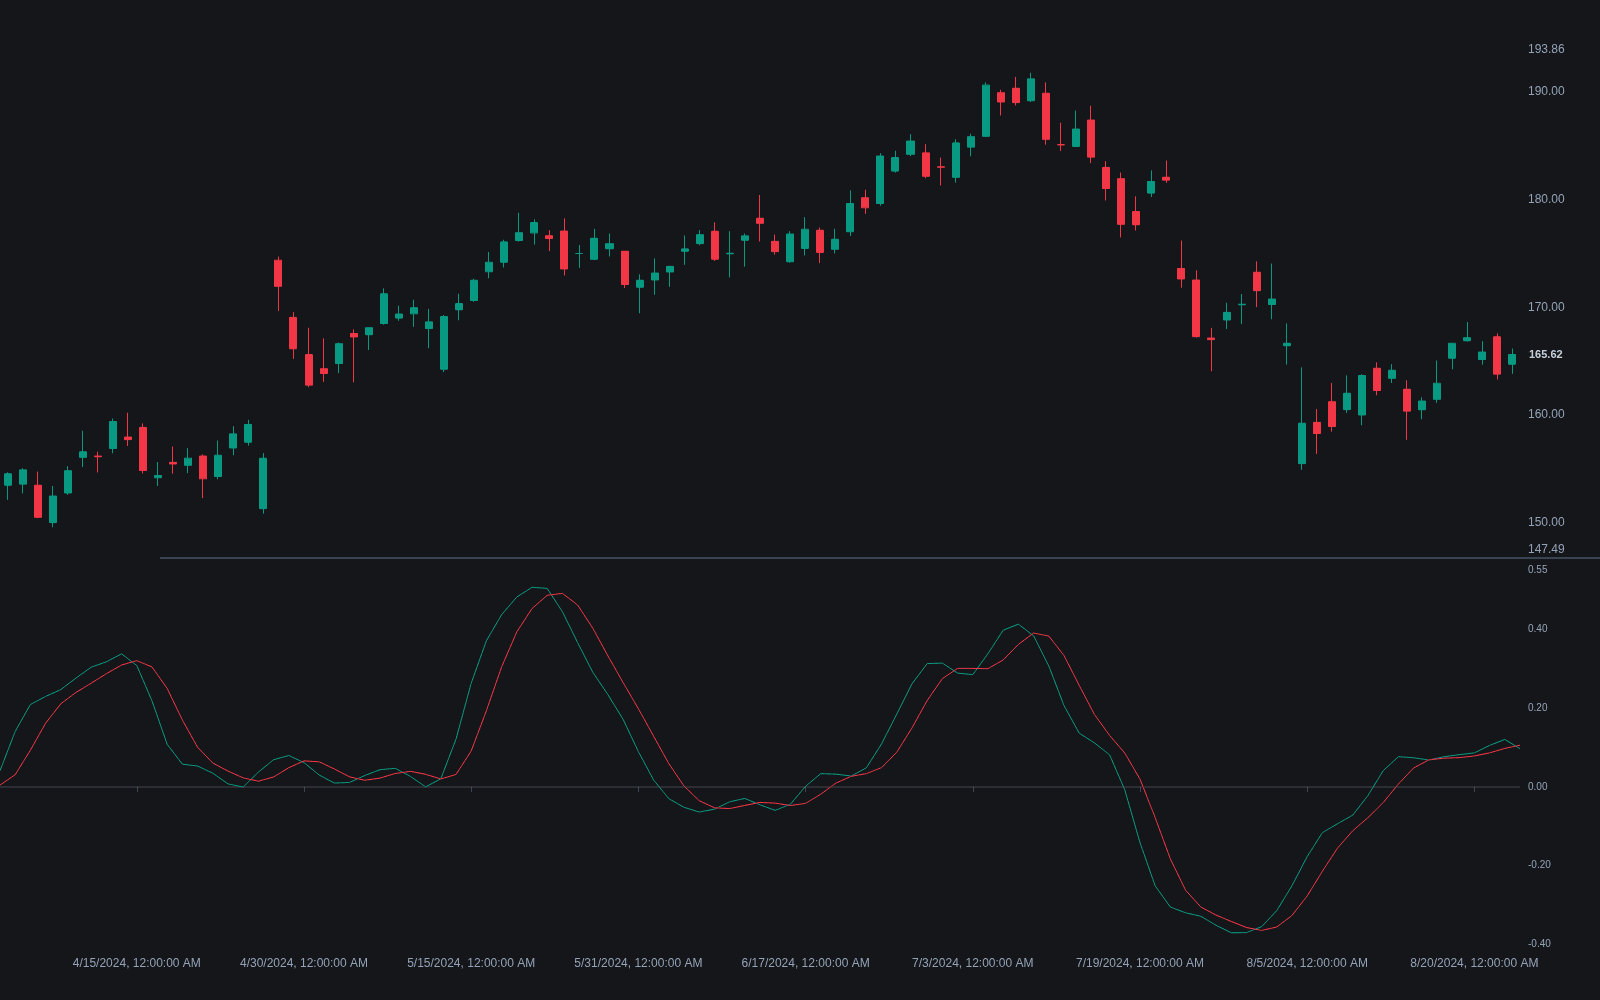
The Relative Vigor Index (RVI) measures the conviction behind price bars by comparing where they close relative to where they open, scaled by their ranges. The premise, articulated by John Ehlers when he published the indicator in 2002, is old floor wisdom: in rising markets bars tend to close above their opens, in falling markets below, and the persistence of that tendency says something about the vigor of the move that raw close-to-close momentum misses.
Construction matters here. Both the numerator (close minus open) and the denominator (high minus low) are smoothed with a 4-bar symmetric weighting, a form of symmetric weighted moving average, and then summed over a lookback window, typically 10 bars. The ratio of the two sums is the RVI line, and a second symmetric smoothing of the RVI itself produces the signal line. The symmetric weights were chosen to filter bar-to-bar noise while adding less lag than a simple average of the same length.
The result oscillates around zero without hard bounds, usually staying within a fraction of one unit. Traders read it much like a smoother stochastic: the zero line for bias, since sustained positive readings accompany markets closing above their opens on balance; line-versus-signal crossovers for timing, more trustworthy when they occur with the prevailing trend; and divergence at extremes, where price makes a new high while the RVI posts a lower high, warning that closes are slipping toward the opens even as price advances.
Its known weaknesses follow from the inputs: on instruments where the open is synthetic or nearly equal to the prior close (many 24-hour markets), close-minus-open carries less information and the indicator's edge thins accordingly. Quiet ranges deserve similar caution, because shrinking bar ranges shrink the denominator, and small absolute changes can produce outsized-looking swings in the line.
How it's calculated
Symmetrically weighted close-open and high-low terms are summed over the window; their ratio is the RVI.
Zero denominators (flat bars) need guarding in code; implementations typically skip or carry forward the prior value.
How traders use it
- As a crossover timing tool inside an established trend, buying RVI/signal upcrosses during pullbacks and ignoring the counter-trend crosses that any oscillator produces.
- As a conviction check on breakouts: a range break accompanied by a rising RVI says the breakout bars are closing near their highs, while a flat RVI flags a break driven by gaps or weak closes.
- For divergence analysis at swing extremes, generally requiring structural confirmation before acting, since vigor can fade for several swings before price actually turns.
- As a complement to close-to-close oscillators like RSI, because RVI's open-to-close input responds to intrabar behavior the others cannot see.
- With its session caveat in mind: on markets without a meaningful daily open, many practitioners either extend the smoothing or prefer other tools outright.
RVI vs similarly named or shaped tools
Relative Volatility Index: Same initials, different object: the Relative Volatility Index applies RSI-style math to standard deviation to measure the direction of volatility. The Relative Vigor Index measures close-versus-open conviction. The shared abbreviation causes real confusion.
Stochastic Oscillator: The stochastic locates the close within the recent range; the RVI locates it relative to the open, bar by bar. Both use signal-line crossovers, but they answer different questions and diverge most on gap-heavy markets.
MACD: MACD builds its line from close-only moving averages, so it tracks direction of drift. RVI can weaken while closes still drift upward, whenever bars start closing progressively nearer their opens.
Concept family
Momentum & Oscillators
91 concepts mapped · 91 in the Library
Relative Vigor Index FAQ
Turn Relative Vigor Index into a trading strategy.
Take the implementation from this page into Quant, then build on it, backtest it on real data, and keep refining it in conversation.