Relative Volatility Index
 By LuxAlgoApr 13, 2020
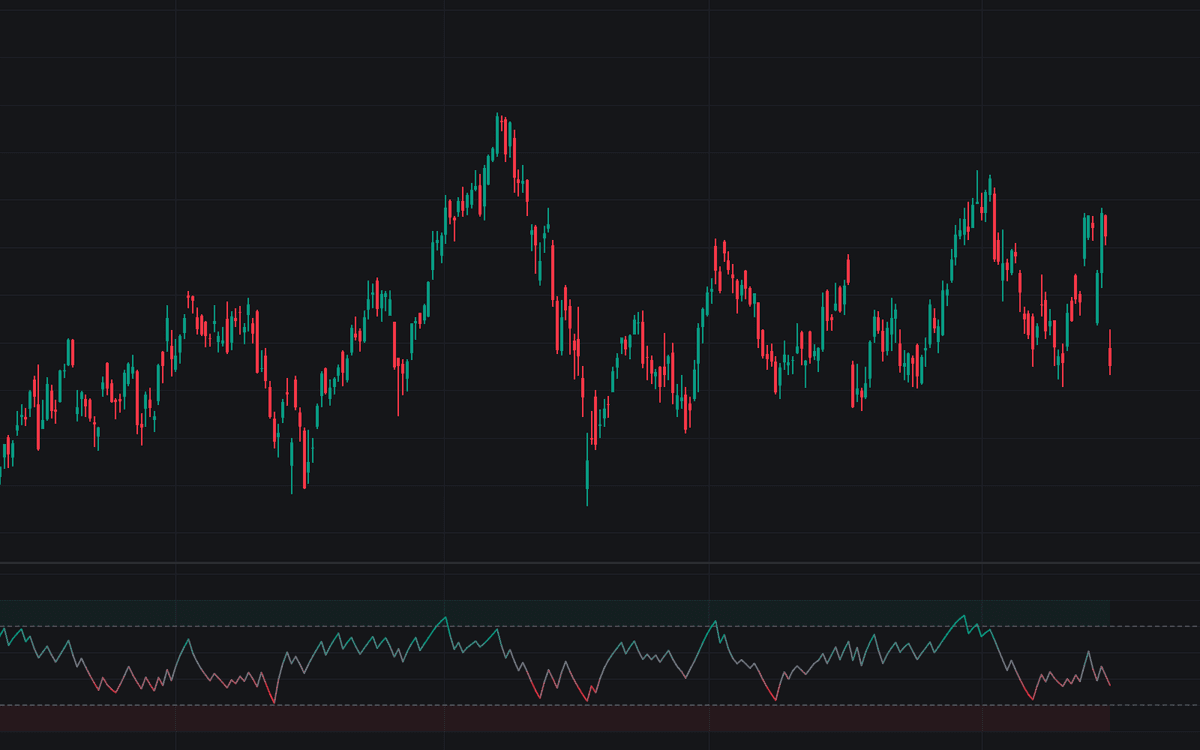

The Relative Volatility Index applies RSI-style smoothing to standard deviation instead of price change, splitting volatility into up-day and down-day components so traders can see which direction volatility is leaning on a 0 to 100 scale. Bar by bar, a rolling standard deviation of closing prices is credited to an up stream when the close rises or a down stream when it falls; both streams are smoothed, and the RVI is the up stream's share of the total, times 100. Defaults are a 10-period standard deviation with 14-period smoothing, a straight implementation of Donald Dorsey's standard formula.
How to Trade the Relative Volatility Index?
- RVI above 50: the volatility is coming from up-closes. Movement favors buyers.
- RVI below 50: down-closes are producing the volatility, the bearish condition.
- RVI above the Overbought Level (80): upside volatility has become one-sided and stretched.
- RVI below the Oversold Level (20): the equivalent downside extreme.
Both levels are drawn as dashed lines, and alerts cover all four boundary events: entering and leaving overbought, entering and leaving oversold.
Relative Volatility Index Settings
- Stdev Length (default 10): the number of bars in the rolling standard deviation of closes used as each bar's volatility reading.
- Smoothing Length (default 14): the number of bars used to smooth the up and down volatility streams.
- Smoothing Type (default EMA): EMA is Dorsey's classic calculation; Wilder (RMA) reproduces implementations built on Wilder smoothing.
- Overbought Level (default 80): the boundary above which volatility is considered concentrated on up moves.
- Oversold Level (default 20): the boundary below which volatility is considered concentrated on down moves.
Frequently Asked Questions

The Library is free. Quant makes it yours.
Pull any concept or indicator into Quant: rebuild it, retune it, or turn it into a backtested strategy of your own.