Concept
Relative Volatility Index
Relative Volatility Index is a Volatility concept. The Library holds 1 implementation, a working definition you can pull into Quant.
The standard Relative Volatility Index indicator
Relative Volatility Index exactly as classically defined: the faithful reference build of the original formula, free to run in Quant.
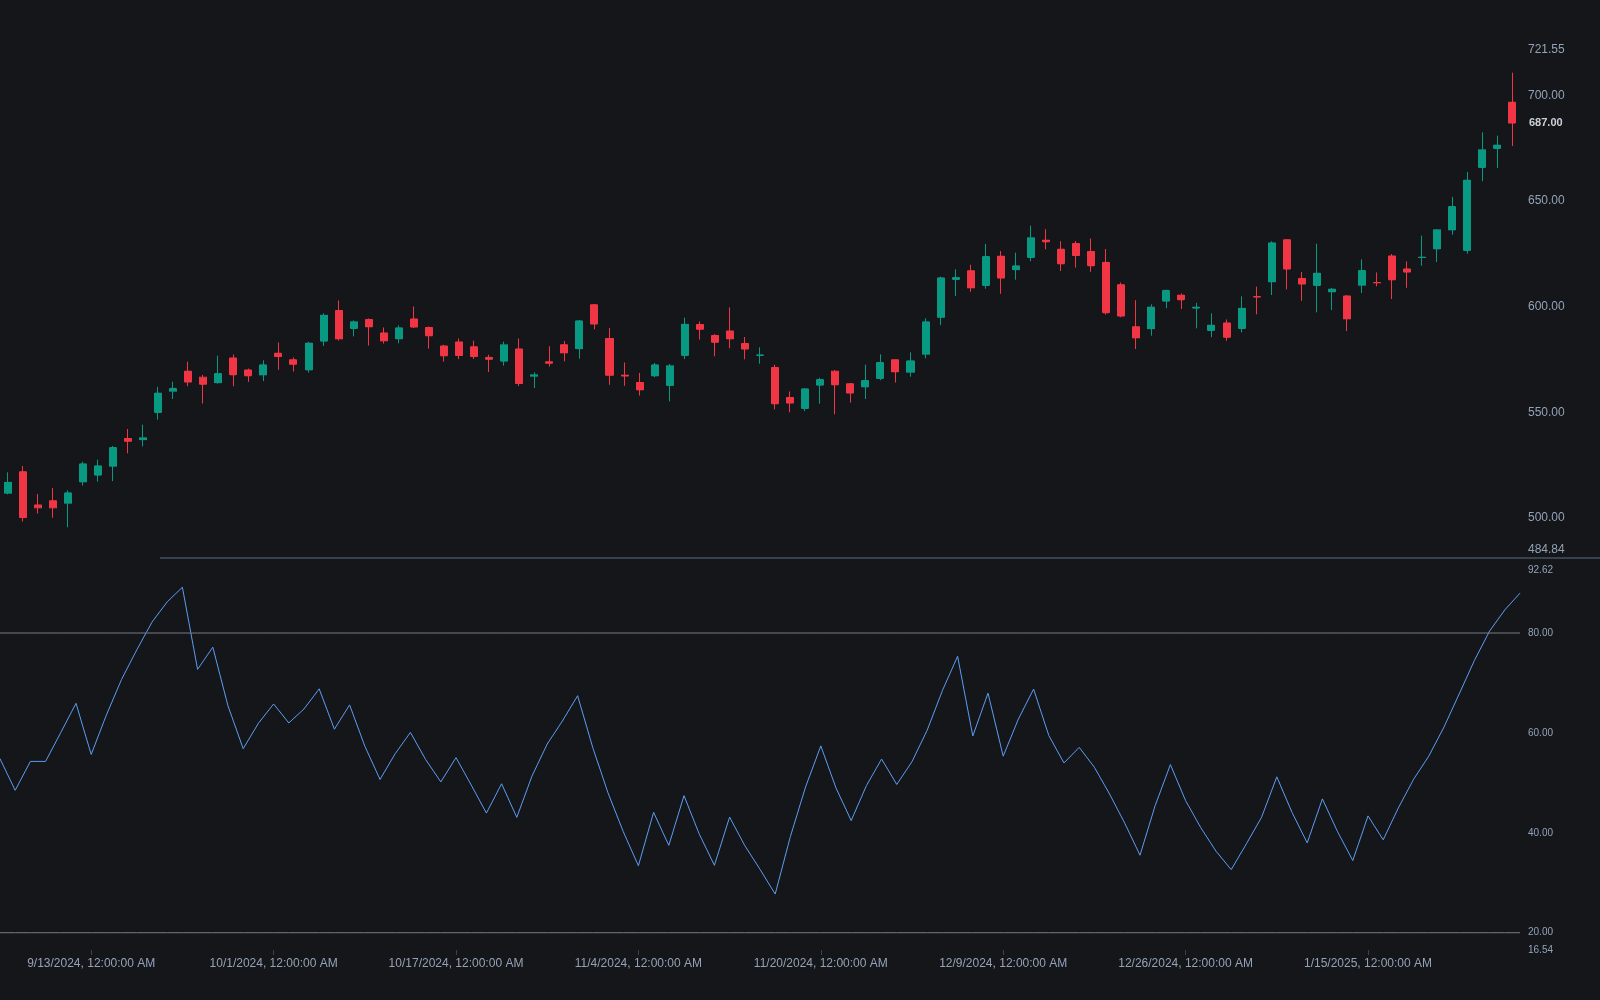
What is the Relative Volatility Index?
The Relative Volatility Index (RVI) is Donald Dorsey's 1993 oscillator that applies RSI arithmetic to volatility instead of price change. Each bar, a rolling standard deviation of closes (10 periods in the original article) is assigned to an up bucket if the close rose or a down bucket if it fell; both buckets are smoothed (Dorsey used 14 periods), and RVI is the smoothed up share times 100. The result oscillates between 0 and 100, with readings above 50 meaning volatility is being generated on up-closes.
Dorsey designed it as a confirmation tool, not a standalone signal: the 50 line marks whether volatility favors buyers or sellers, and his published rules only allowed trades in the direction RVI endorsed, with outer thresholds governing missed entries and exits. His 1995 refinement ran the calculation on highs and lows separately and averaged the two. Note the naming collision: the Relative Vigor Index shares the RVI abbreviation but is a different indicator entirely.
The construction has a subtlety worth spelling out: standard deviation is always positive, so the indicator's direction comes entirely from the assignment step. The dispersion number itself says how energetic the bar's neighborhood is; crediting it to the up or down bucket by the close's direction converts unsigned energy into a signed share. That is why RVI answers a question neither ATR nor realized volatility addresses. Those measure how much the market is moving; RVI measures which side the movement is working for, a directional dissection of volatility rather than another size gauge.
In the modern toolkit it slots naturally into compression-expansion workflows. Squeeze frameworks flag that energy is loading; RVI leaning above or below 50 during the compression is one read on which way that energy is tilted when it releases, a pairing squeeze traders make with TTM Squeeze style tools. everget's Library port is the standard modern reference implementation, Regi_Lantern's RSI & RVI pairs it with its price-side sibling on one panel, and PuguForex's Directional Volatility and Volume extends the same idea with a participation check.
How to identify the Relative Volatility Index
The construction is RSI with one substitution, so the checklist is short and the substitution is the point.
- 1Compute a rolling standard deviation of closes, 10 periods in the original design.
- 2Assign each bar's dispersion value to the up bucket when the close rose, the down bucket when it fell.
- 3Smooth both buckets over the signal window, 14 periods in Dorsey's article, using RSI-style averaging.
- 4Plot the up share times 100: a 0-100 oscillator whose 50 line divides buyer-favored from seller-favored volatility.
- 5Read it Dorsey's way: 50 as the confirmation gate, the outer zones for missed-entry and exit refinements, and divergences against price as the warning layer.
How it's calculated
A 0 to 100 oscillator that applies RSI arithmetic to standard deviation rather than price change, showing whether volatility sits on up moves or down moves.
Donald Dorsey (1993); his 1995 revision computes the index on highs and lows separately and averages the two results.
Some platforms use Wilder smoothing in place of the EMA.
Distinct from the Relative Vigor Index, which shares the RVI acronym.
How traders use it
- As a confirmation gate: momentum or trend entries are taken only when RVI agrees, above 50 for longs and below 50 for shorts, filtering out signals that lack volatility support.
- As a divergence tool: RVI making lower highs while price makes higher highs is read as bearish divergence in the volatility backing the move, and the bullish mirror applies at lows.
- As a companion to RSI: RSI tracks the direction of price change, RVI tracks the direction of volatility, and agreement between the two is treated as a stronger overbought/oversold read than either gives alone.
- As a squeeze-direction tell: while a compression regime builds, RVI holding one side of 50 offers a lean on the eventual break's direction, treated as a tilt to be confirmed by the break itself rather than a forecast.
- Alongside volatility-level context: pairing RVI's directional share with a volatility percentile or rank read distinguishes one-sided volatility in a dead market from one-sided volatility in an energetic one, which carry very different weight.
Relative Volatility Index vs related measures
RSI: Identical arithmetic, different fuel: RSI feeds signed price changes into its averages, RVI feeds unsigned dispersion assigned by close direction. RSI asks who is winning on price; RVI asks whose moves carry the energy. Dorsey built RVI to confirm, not replace, its sibling.
ATR: ATR measures the size of movement and deliberately ignores direction, which is why it serves stops and position sizing. RVI throws away none of the direction: it splits volatility by which side generated it. One sizes the storm, the other reports which way the wind blows.
BandWidth: BandWidth tracks total volatility through the spread of Bollinger Bands, flagging compression and expansion regimes. RVI allocates volatility between buyers and sellers. They compose naturally: BandWidth says energy is loading or releasing, RVI says which side has been supplying it.
Concept family
Volatility
57 concepts mapped · 57 in the Library
Relative Volatility Index FAQ
Turn Relative Volatility Index into a trading strategy.
Take the implementation from this page into Quant, then build on it, backtest it on real data, and keep refining it in conversation.