Schaff Trend Cycle
 By LuxAlgoMay 6, 2026
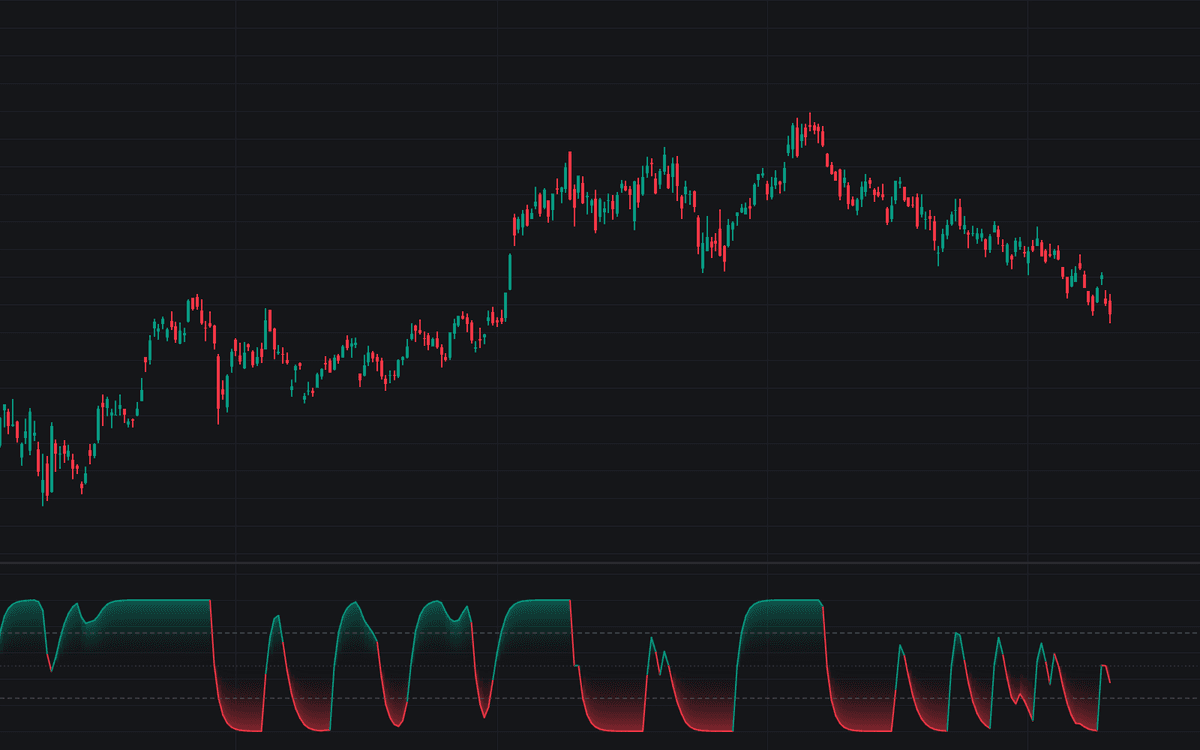

Schaff Trend Cycle is the definitive clean build of the Schaff Trend Cycle: a MACD computed from 23- and 50-period EMAs, passed twice through a 10-bar stochastic normalization with recursive smoothing after each pass. The result is a fast 0-100 line, colored by its side of the 50 midline with a gradient fill, framed by dashed trigger lines at 75 and 25 and a dotted midline.
How to Trade the Schaff Trend Cycle?
- Cross up through the Lower Trigger: the classic emerging-uptrend signal, taken as the cycle lifts off its floor.
- Cross down through the Upper Trigger: the mirrored emerging-downtrend signal.
- Pinned readings: a line parked against 0 or 100 usually means the trend is still delivering: the cycle saturates at its bounds by design rather than signaling exhaustion.
Four alerts cover both trigger crosses and both entries into the extreme zones; the pane markers for trigger crossings stay off by default so the alerts can do the work.
Schaff Trend Cycle Settings
- Source (default close): price series behind the underlying MACD.
- Fast Length (default 23) and Slow Length (default 50): the MACD's EMAs, deliberately slower than the classic 12/26. The stochastic passes provide the reaction speed, so the trend leg can stay steady.
- Cycle Length (default 10): window of both stochastic passes.
- Smoothing Factor (default 0.5): recursive smoothing applied after each pass; higher values react faster.
- Upper Trigger (default 75) / Lower Trigger (default 25): the crossing levels.
- Gradient Fill is on and Trigger Crossing Markers off by default.
Frequently Asked Questions

Original indicatorBuilt in-house by LuxAlgo
The Library is free. Quant makes it yours.
Pull any concept or indicator into Quant: rebuild it, retune it, or turn it into a backtested strategy of your own.