SMI Ergodic
 By LuxAlgoApr 13, 2020
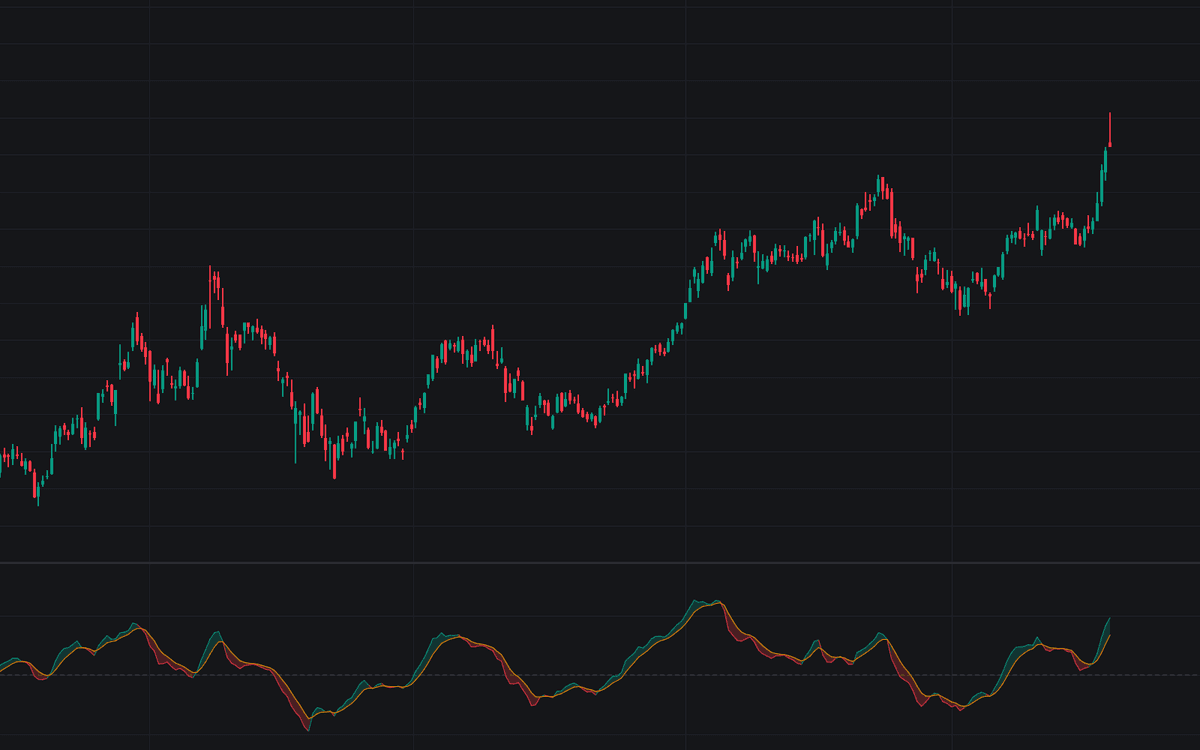

The SMI Ergodic is the ergodic form of the True Strength Index (double EMA-smoothed price change divided by double EMA-smoothed absolute price change), giving traders a heavily filtered momentum line paired with a signal line for timing. It follows the naming convention that became standard in charting practice: momentum-based rather than the range-anchored formula sharing its initials. Defaults are TSI lengths 5 and 20 with an EMA-5 signal line, plus a display option to show the SMI with its signal line or as an oscillator of their difference. This is the plain standard implementation of that form.
How to Trade the SMI Ergodic?
- Zero-line position: above zero, double-smoothed price change is net positive and up moves dominate the window; below zero the balance is downward.
- Signal-line crosses: a cross above marks momentum turning up, a cross below momentum rolling over, strongest when they agree with the larger trend.
- Zero-line crosses: slower, regime-level shifts that recolor every subsequent signal cross.
- Shrinking oscillator columns: in Oscillator display, the narrowing histogram warns the lines are converging before a cross prints.
Alerts cover all four events: bullish and bearish signal-line crosses and zero crosses.
SMI Ergodic Settings
- Long Length (default 20): the length of the first EMA smoothing applied to the momentum of the closing price, the indicator's overall horizon.
- Short Length (default 5): the length of the second EMA smoothing; raising it slows the line further.
- Signal Length (default 5): the length of the EMA of the SMI that forms the signal line. Longer signals produce fewer, later crosses.
- Display (default Indicator): Indicator plots the SMI and its signal line; Oscillator replaces them with a histogram of the difference, colored by rise or fall.
Frequently Asked Questions

The Library is free. Quant makes it yours.
Pull any concept or indicator into Quant: rebuild it, retune it, or turn it into a backtested strategy of your own.