Concept
Stochastic Momentum Index
Stochastic Momentum Index is a Momentum & Oscillators concept. The Library holds 1 implementation, a working definition you can pull into Quant.
SMI
The standard Stochastic Momentum Index indicator
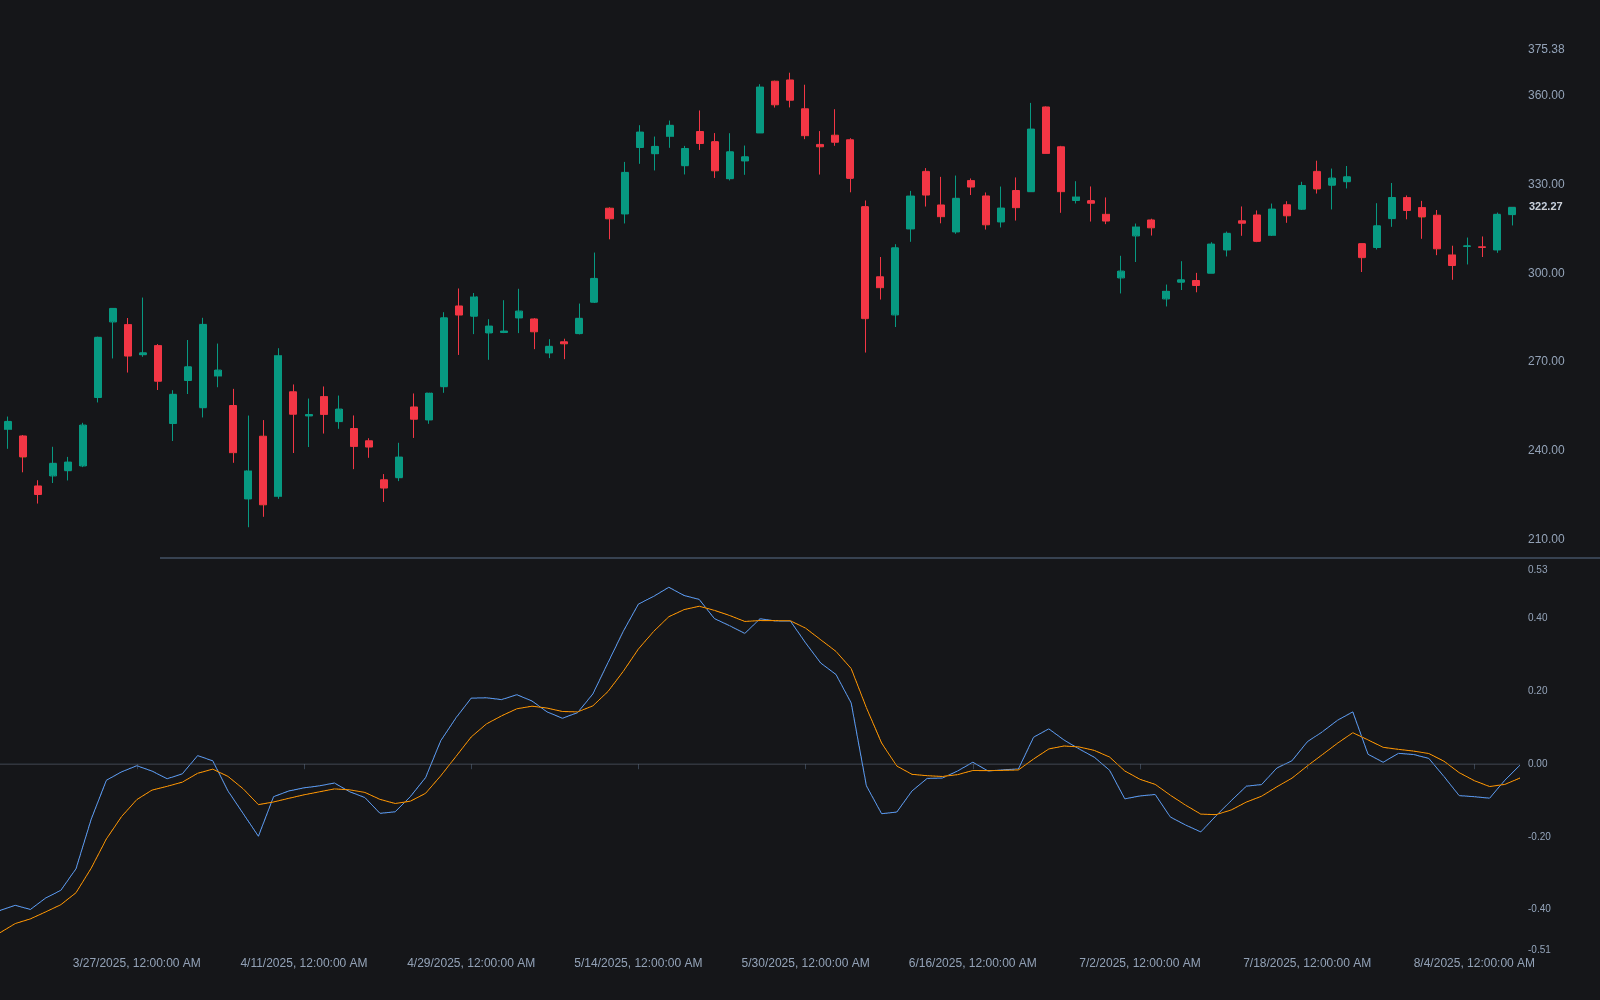
Stochastic Momentum Index exactly as classically defined: the faithful reference build of the original formula, free to run in Quant.
What is the Stochastic Momentum Index?
The Stochastic Momentum Index (SMI), introduced by William Blau in 1993, relocates the stochastic's anchor point. A standard Stochastic Oscillator asks where the close sits between the period's high and low; the SMI asks how far the close sits from the midpoint of that high-low range, then double-smooths both that distance and the range itself with successive EMAs before dividing. Scaling by half the smoothed range bounds the result near plus and minus 100, with zero meaning the close sat exactly at the range midpoint.
The double EMA smoothing is the point: raw %K can jump between extremes on every bar, while the SMI's numerator and denominator are each smoothed twice, producing a line that drifts rather than snaps. Readings are conventionally judged against plus and minus 40 for overbought and oversold, with a signal-line EMA layered on for crossovers. It shares its double-smoothing DNA with Blau's True Strength Index: one smooths the close's distance from the range midpoint, the other smooths bar-to-bar price change.
Blau introduced the SMI in the January 1993 issue of Technical Analysis of Stocks & Commodities and expanded it in his 1995 book Momentum, Direction, and Divergence. His project was noise reduction without the heavy lag of long lookbacks: two short EMAs in series filter more bar-to-bar noise for a given lag than a single longer average, and smoothing numerator and denominator identically keeps the ratio's scale honest. The SMI is that idea applied to George Lane's stochastic.
In practice the SMI behaves like a slower, centered stochastic. Zero-line position carries trend information the 0-100 stochastic lacks, and the smoothed line makes swing comparison cleaner for divergence work, including hidden divergence in pullbacks. The cost is lag: turns register later than on a raw stochastic or momentum line, which suits swing timeframes better than fast scalping. Traders wanting sharper extremes sometimes pass the SMI through an Inverse Fisher Transform, as in the library's KivancOzbilgic study.
How to calculate the Stochastic Momentum Index
The calculation applies the same double smoothing to a distance series and a range series.
- 1Over the lookback window, find the highest high and lowest low; their average is the range midpoint.
- 2Compute the distance: close minus that midpoint. Unlike %K's close-minus-low, this is negative whenever the close is in the lower half of the range.
- 3Smooth the distance with an EMA, then smooth the result with a second EMA; apply the identical double smoothing to the high-low range.
- 4Divide the double-smoothed distance by half the double-smoothed range and multiply by 100, giving a reading near the plus/minus 100 bounds; an EMA of the SMI serves as the signal line.
How it's calculated
Locates the close relative to the midpoint of the recent high/low range, double smoothed and scaled to -100 to +100.
A value of 0 puts the close exactly at the midpoint of the n bar range; +40 and -40 are common overbought and oversold marks.
A signal line, typically a 3 period EMA of the SMI, is plotted alongside.
William Blau's indicator, introduced in 1993; platform defaults vary but 10, 3, 3 is the most common.
How traders use it
- For overbought/oversold reversion: readings beyond plus or minus 40 mark stretch, with entries commonly waiting for the SMI to hook back toward zero rather than fading the first touch.
- For signal-line crossovers, which fire less often than standard stochastic crosses because both lines are already double-smoothed.
- For zero-line context: above zero, closes are persistently in the upper half of their recent range, a trend-quality read as much as a momentum one.
- For divergence at swing extremes, where the smoothing makes peaks easier to compare, at the cost of signals arriving later than the raw stochastic's.
- As a base for composite studies: the formula ports to other inputs, as in the library's SMI of the Money Flow Index, and pairs well with a trend filter such as MACD slope for timing entries.
Stochastic Momentum Index vs. related oscillators
Stochastic Oscillator: The stochastic anchors to the period low and lives on a 0-100 scale; the SMI anchors to the range midpoint, centers at zero, and double-smooths everything, so it turns later but whipsaws less.
Stochastic RSI: Stochastic RSI applies the stochastic formula to RSI values, making a bounded series twitchier; the SMI goes the opposite way, re-anchoring and double-smoothing to slow the stochastic down. They sit at opposite ends of the responsiveness spectrum.
RSI: RSI measures the balance of up and down closes with no reference to the high-low range; the SMI measures where the close sits within that range. RSI centers at 50 on a 0-100 scale, the SMI at zero on a plus/minus 100 scale.
Concept family
Momentum & Oscillators
91 concepts mapped · 91 in the Library
Stochastic Momentum Index FAQ
Turn Stochastic Momentum Index into a trading strategy.
Take the implementation from this page into Quant, then build on it, backtest it on real data, and keep refining it in conversation.