Concept
Standard Deviation
Standard Deviation, also known as stdev, sigma, is a Statistics concept. The Library holds 1 implementation, a working definition you can pull into Quant.
The standard Standard Deviation indicator
Standard Deviation exactly as classically defined: the faithful reference build of the original formula, free to run in Quant.
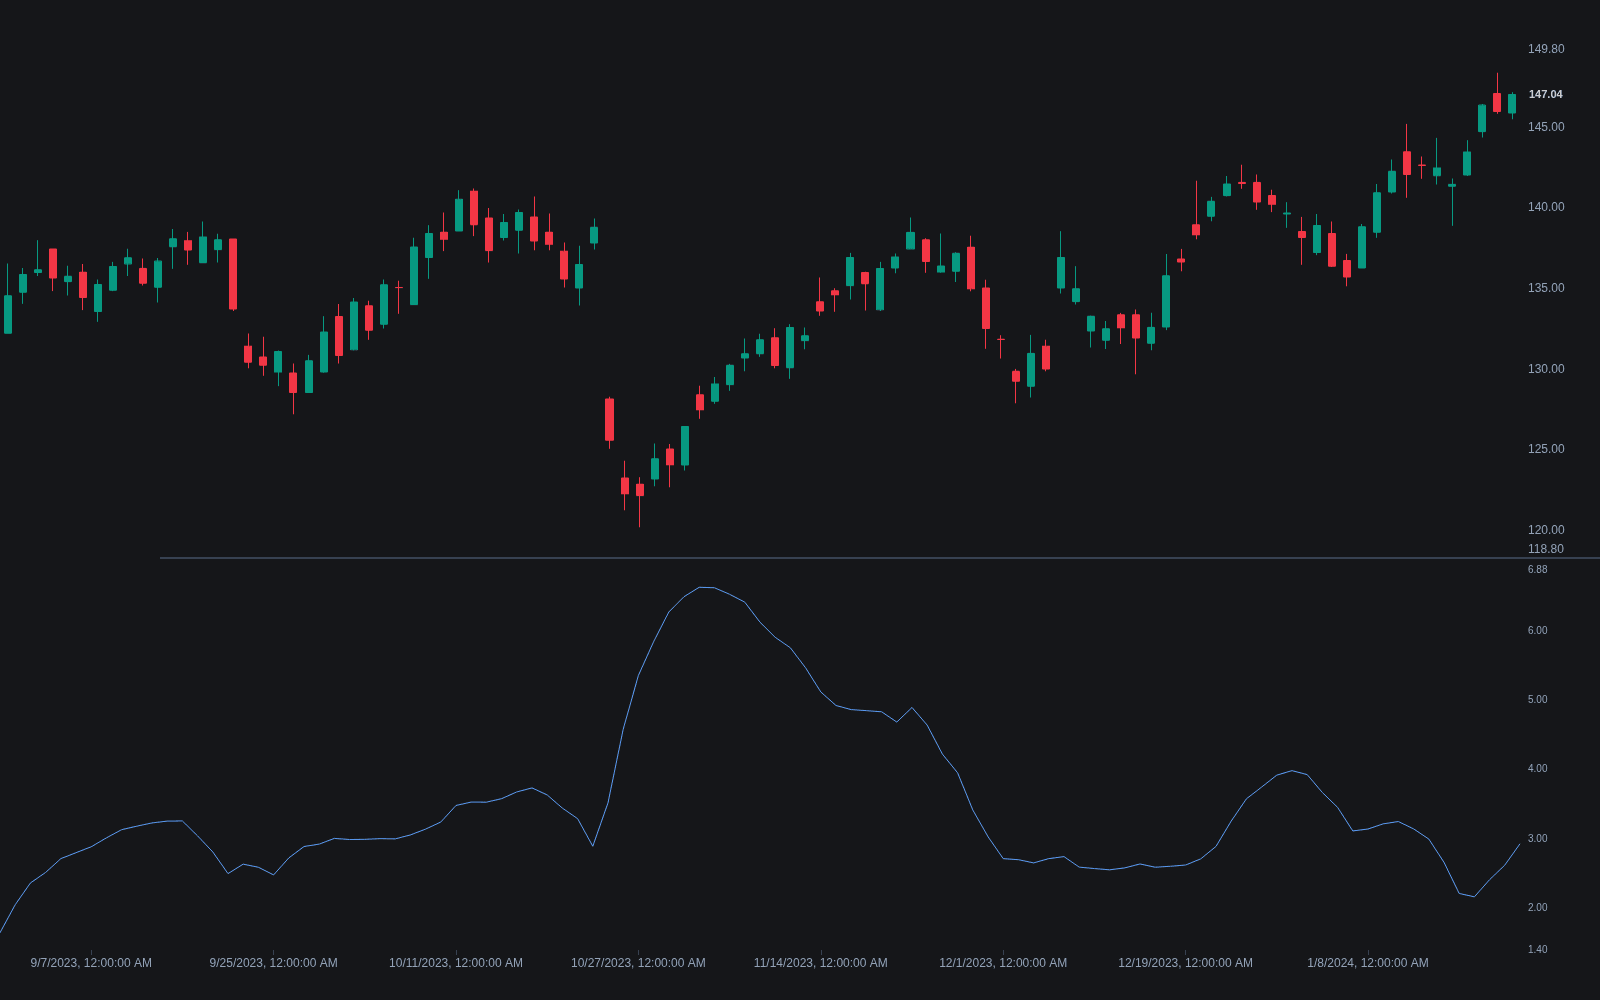
What is standard deviation?
Standard deviation, often abbreviated stdev and written with the Greek letter sigma, is the classic statistical measure of dispersion: the square root of the average squared distance between each observation and the mean. A small value means the data hug their average; a large value means they scatter widely. In trading it is the workhorse estimate of variability, applied to closing prices, returns, indicator readings, and equity curves alike.
Technical analysis uses it in two distinct ways that are worth keeping separate. Applied to returns, standard deviation is the conventional definition of volatility, the quantity that realized volatility estimators refine and that risk models scale by. Applied to prices around a moving average, it becomes a band-width generator, most famously in Bollinger Bands, where envelopes sit a chosen number of deviations from the mean and adapt automatically as dispersion expands and contracts.
Traders care because standard deviation converts "how much does this thing move" into a single comparable number, enabling normalization (z-scores), position sizing, and adaptive indicator widths. Its main caveat is the assumption baggage: it weights large deviations quadratically, and financial returns are fat-tailed and skewed, so sigma-based rules of thumb (like two deviations covering roughly 95% of outcomes) borrowed from the normal distribution tend to understate how often extreme moves occur.
How it's calculated
The rolling population form below is what most charting platforms compute for indicator purposes.
Charting platforms usually use the population divisor n; statistics texts favor the sample divisor n - 1. On common lookbacks the difference is small but real.
Standard deviation of prices and standard deviation of returns are different quantities with different uses; annualized volatility multiplies the per-period return stdev by the square root of the number of periods per year.
How traders use it
- As a volatility gauge: rolling standard deviation of returns summarizes how turbulent an instrument currently is, feeding volatility-targeted sizing and regime filters.
- As band construction: Bollinger-style envelopes plot a moving average plus and minus k deviations, widening in turbulent periods and tightening in quiet ones, with the tightening itself watched as a squeeze precursor.
- As normalization: dividing a deviation from the mean by the standard deviation yields a z-score, letting traders compare stretch across instruments and eras on a common scale.
- As projection scaffolding: some frameworks extend deviations from an anchor to frame expected travel, as in standard deviation projections and VWAP bands.
- With limitations in view: sigma is backward-looking, sensitive to the lookback choice, distorted by single outliers, and calm readings say nothing about the risk of a sudden regime change.
Standard deviation vs neighboring measures
ATR: ATR averages true ranges, capturing intrabar travel and gaps in price units without reference to a mean; standard deviation measures dispersion around an average and squares deviations, so the two can disagree about how volatile a market feels.
Z-Score: A z-score is a derived quantity: the current deviation from the mean expressed in standard deviations. Sigma measures spread; the z-score locates one observation within that spread.
Realized Volatility: Realized volatility is standard deviation applied specifically to returns, usually annualized, with refinements (intraday sampling, alternative estimators) aimed at measuring the same dispersion more efficiently.
Concept family
Statistics
46 concepts mapped · 46 in the Library
Standard Deviation FAQ
Turn Standard Deviation into a trading strategy.
Take the implementation from this page into Quant, then build on it, backtest it on real data, and keep refining it in conversation.