Stochastic
 By LuxAlgoApr 13, 2020
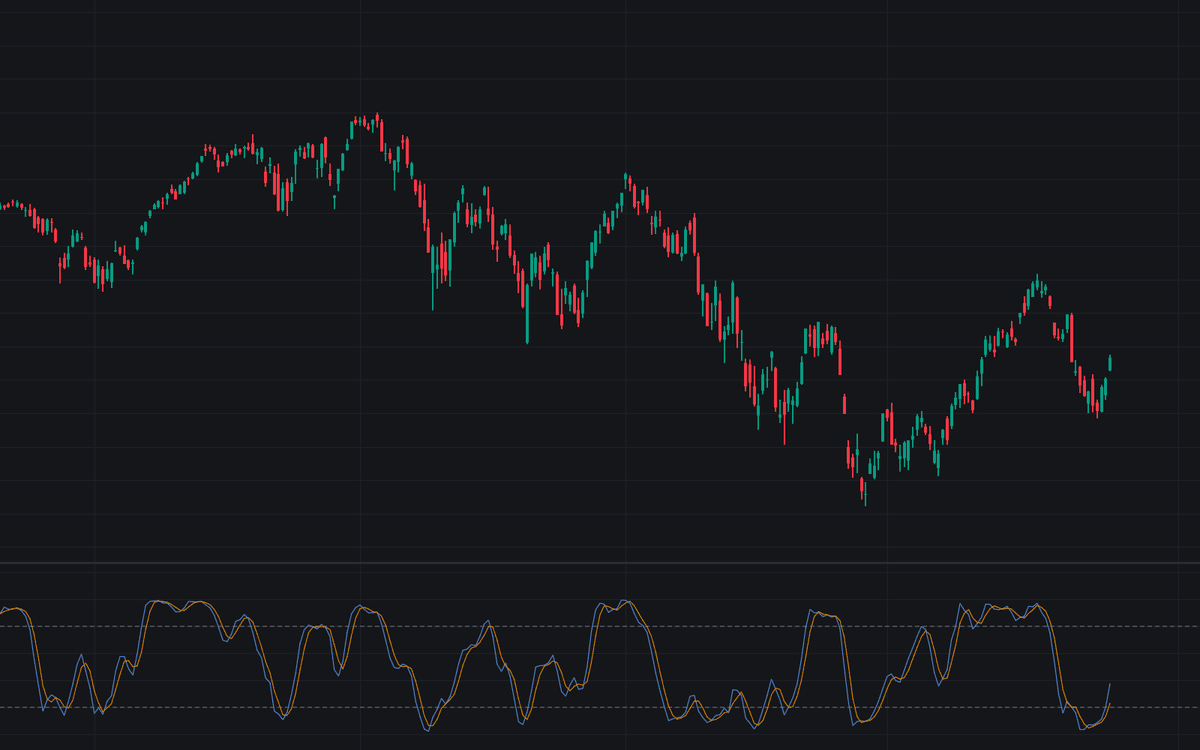

The Stochastic locates the current close within the high-low range of a lookback window, plotting the %K line alongside a %D signal line on a 0 to 100 scale. George Lane's insight: late in an advance, closes start finishing lower inside each bar's range even while new highs print, and the oscillator surfaces that slippage. This is the standard raw implementation of Lane's stochastic with the classic parameter set: a 14-bar %K smoothed over 3 bars, a 3-bar %D, and dashed reference levels at 80 and 20 with a shaded band between them.
How to Trade the Stochastic?
- %K above 80: closes settling near the top of the recent range: overbought, most meaningful as a fade in range-bound conditions.
- %K below 20: closes pressing the bottom of the range: oversold, with the mirror caution.
- Bullish %K/%D cross: the classic timing trigger, strongest from inside the oversold zone.
- Bearish %K/%D cross: the mirror trigger, strongest from overbought.
- Divergence: a new price extreme on a lesser %K reading warns that range position is deteriorating.
In strong trends the oscillator parks at an extreme, so an 80-plus reading alone is no argument to sell. The tool works best behind a directional read.
Stochastic Settings
- %K Length (default 14): bars for the highest-high/lowest-low range of raw %K; shorter reacts faster but whipsaws.
- %K Smoothing (default 3): the SMA applied to raw %K: 1 gives the fast stochastic, 3 the classic slow version.
- %D Smoothing (default 3): the moving-average length of the signal line; shorter fires crosses earlier and more often.
- Overbought Level (default 80) and Oversold Level (default 20): the reference thresholds; widening toward 90/10 filters strong-trend noise.
Alerts
Six alert conditions: bullish and bearish %K/%D crosses, plus %K entering and exiting the overbought and oversold zones.
Frequently Asked Questions

The Library is free. Quant makes it yours.
Pull any concept or indicator into Quant: rebuild it, retune it, or turn it into a backtested strategy of your own.