Concept
Stochastic Oscillator
Stochastic Oscillator, also known as fast/slow/full, %K/%D, stochastic cross, is a Momentum & Oscillators concept. The Library holds 6 implementations, each one a working definition you can pull into Quant.
Top Stochastic Oscillator indicators
The top custom implementations, built on the original standard Stochastic Oscillator formula.
6 total
Any of the 6 Stochastic Oscillator implementations below can become a backtested trading strategy — describe your rules and Quant writes the code.
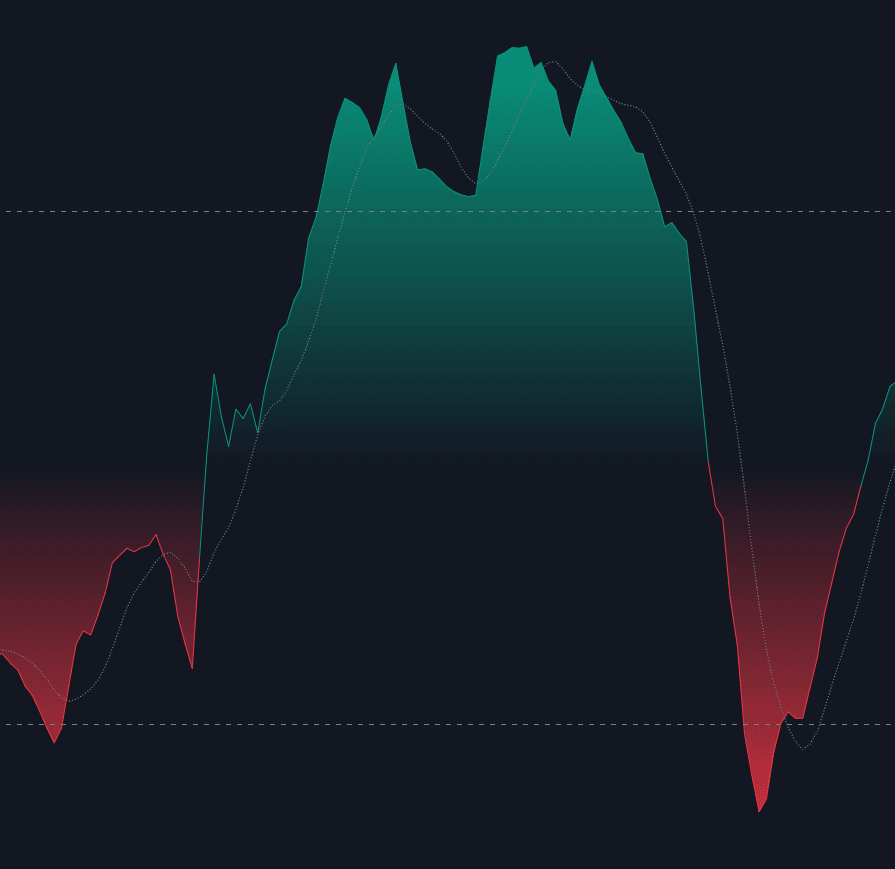
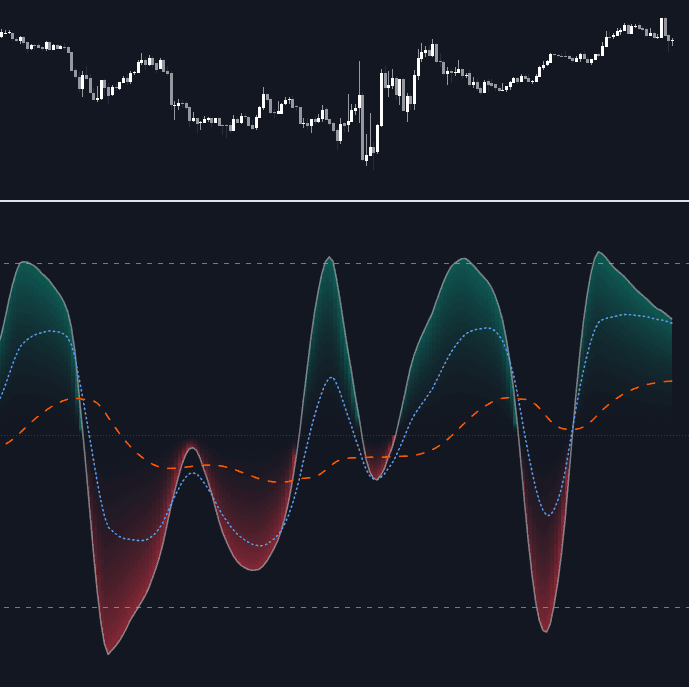
.png&w=3840&q=75)
The standard Stochastic Oscillator indicator
Stochastic Oscillator exactly as classically defined: the faithful reference build of the original formula, free to run in Quant.
What is the Stochastic Oscillator?
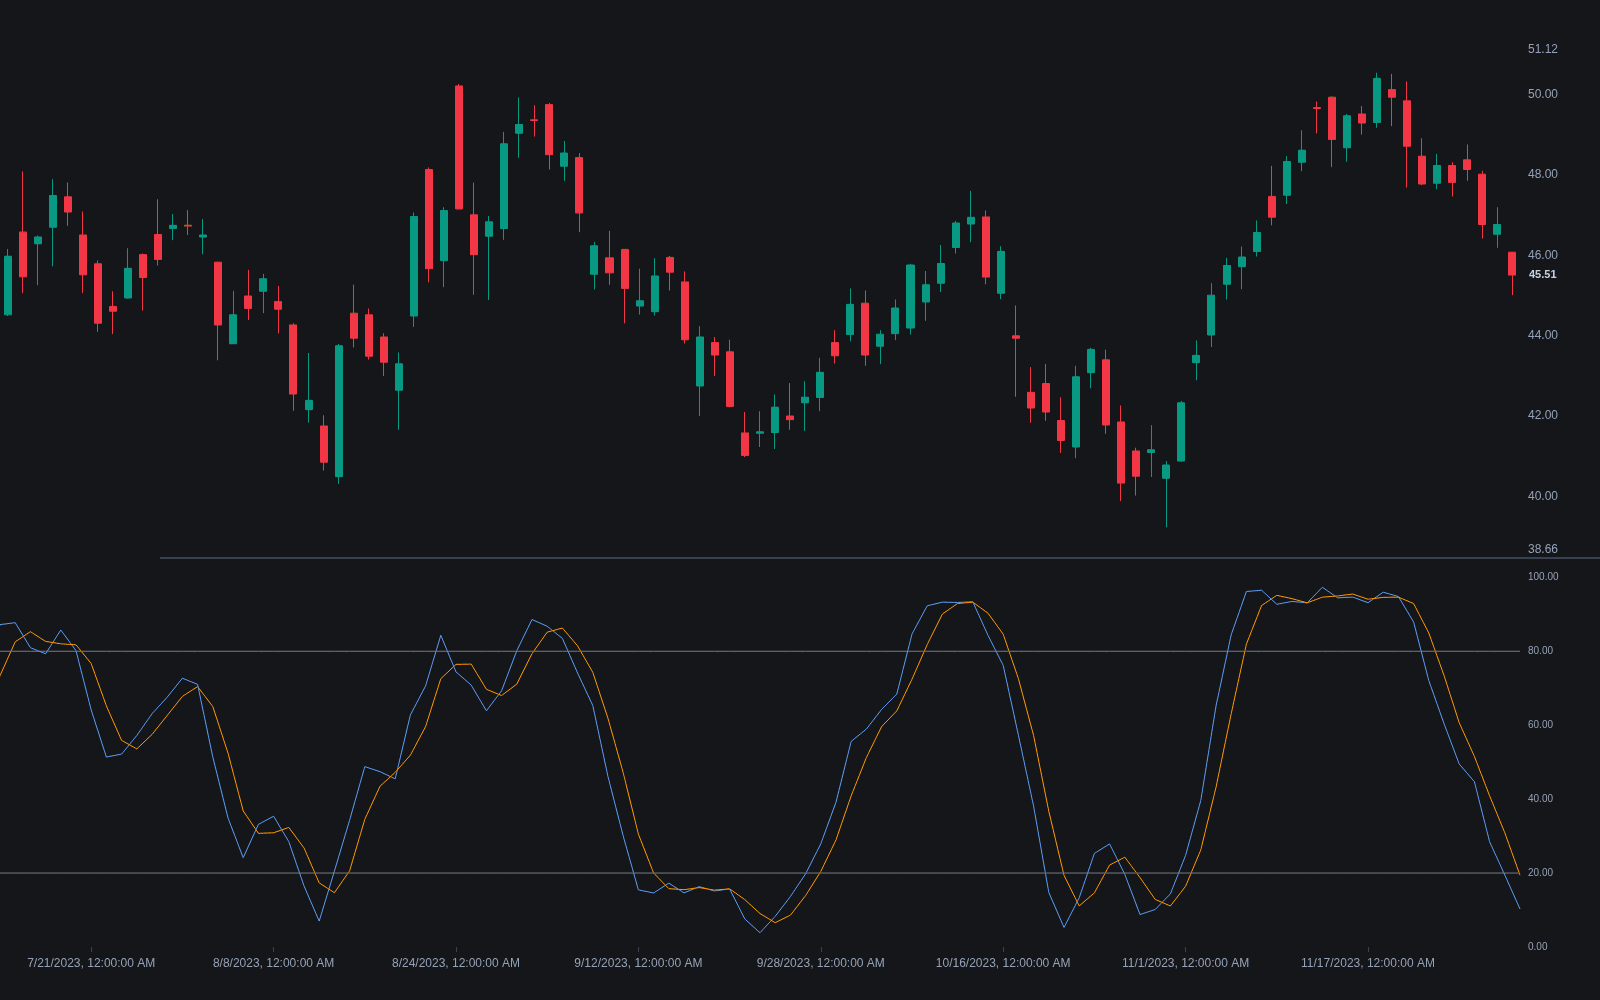
The Stochastic Oscillator, developed by George Lane in the 1950s, measures where the latest close sits inside the recent high-low range. Its %K line equals 100 times (close minus the lowest low of the lookback) divided by (highest high minus lowest low), so a reading of 80 puts the close in the top fifth of the last 14 bars' range (14 being the common length). %D, the signal line, is a 3-period simple moving average of %K.
Lane's premise was that momentum turns before price: in an advance, closes cluster near the top of the range and begin slipping toward the middle before the highs stop coming. Three variants trade speed for smoothness. Fast stochastic plots raw %K; slow stochastic uses a 3-period average of raw %K as its %K and smooths %D again; full stochastic exposes the lookback, the slowing, and the %D length as separate parameters.
The oscillator matters because its grammar became a template: 80/20 overbought/oversold zones, %K/%D crossovers, and divergence reads all generalize across the oscillator family, and descendants such as the Stochastic RSI and the Stochastic Momentum Index reuse the core calculation. It is fast, bounded, and blunt: strong trends pin it at the extremes, so regime context decides how it should be read.
How to calculate the Stochastic Oscillator
The calculation needs only highs, lows, and closes over a lookback window.
- 1Choose a lookback N (14 is conventional) and find the highest high and lowest low across those N bars.
- 2Compute raw %K: 100 times (close minus the lowest low) divided by (highest high minus the lowest low). The result is bounded between 0 and 100 by construction.
- 3Smooth if desired: the slow version uses a 3-period SMA of raw %K as its %K line, and %D is a 3-period SMA of whichever %K you plot. The full version makes all three lengths adjustable.
- 4Read the result through three lenses: position against the 80/20 zones, %K crossing %D, and divergence between oscillator swings and price swings.
How it's calculated
The position of the latest close inside the recent high-low range, scaled from 0 to 100.
Default settings are (14, 3, 3); readings above 80 are conventionally overbought and below 20 oversold.
When HH_n = LL_n the denominator is zero; implementations hold the prior %K or leave the bar undefined.
SMA is the standard smoothing; platforms offering EMA smoothing shift the crosses earlier.
How traders use it
- As a pullback trigger inside trends: with a higher-timeframe trend filter pointing up, an oversold %K/%D cross back above 20 times entries in the trend's direction instead of fighting it.
- As a mean-reversion gauge inside a trading range, fading excursions past 80/20 as the close's position in the range rotates; this is the read that fails when a breakout turns the range into a trend.
- As a divergence engine: Lane himself emphasized divergence, price making a new swing extreme that %K does not confirm, with the crossover then serving as the trigger.
- As a continuation read: Stochastic Pop style approaches buy a push above 80 and hold while the reading stays pinned, the deliberate inverse of the reversion interpretation.
Stochastic Oscillator vs related oscillators
RSI: RSI averages the size of up closes against down closes; the stochastic locates the close inside the high-low range. One responds to the magnitude of changes, the other to position within the range, so a quiet drift near the top of the range can keep the stochastic pinned while RSI eases back.
Williams %R: %R is the same range-location arithmetic measured from the top of the range: it equals %K minus 100, plotted on a 0 to -100 scale, traditionally without smoothing or a signal line. The information content is identical.
Stochastic RSI: The Stochastic RSI feeds RSI values, not prices, through this same formula, making it an indicator of an indicator: faster, pinned at its boundaries more often, and two derivations removed from price.
Stochastic Momentum Index: The SMI measures the close relative to the midpoint of the high-low range rather than to its extremes, then double-smooths the result, so it oscillates around zero and reads like a calmer, centered cousin.
More Stochastic Oscillator implementations
Concept family
Momentum & Oscillators
91 concepts mapped · 91 in the Library
Stochastic Oscillator FAQ
Turn Stochastic Oscillator into a trading strategy.
Take any implementation from this page into Quant, then build on it, backtest it on real data, and keep refining it in conversation.