True Strength Index
 By LuxAlgoApr 13, 2020
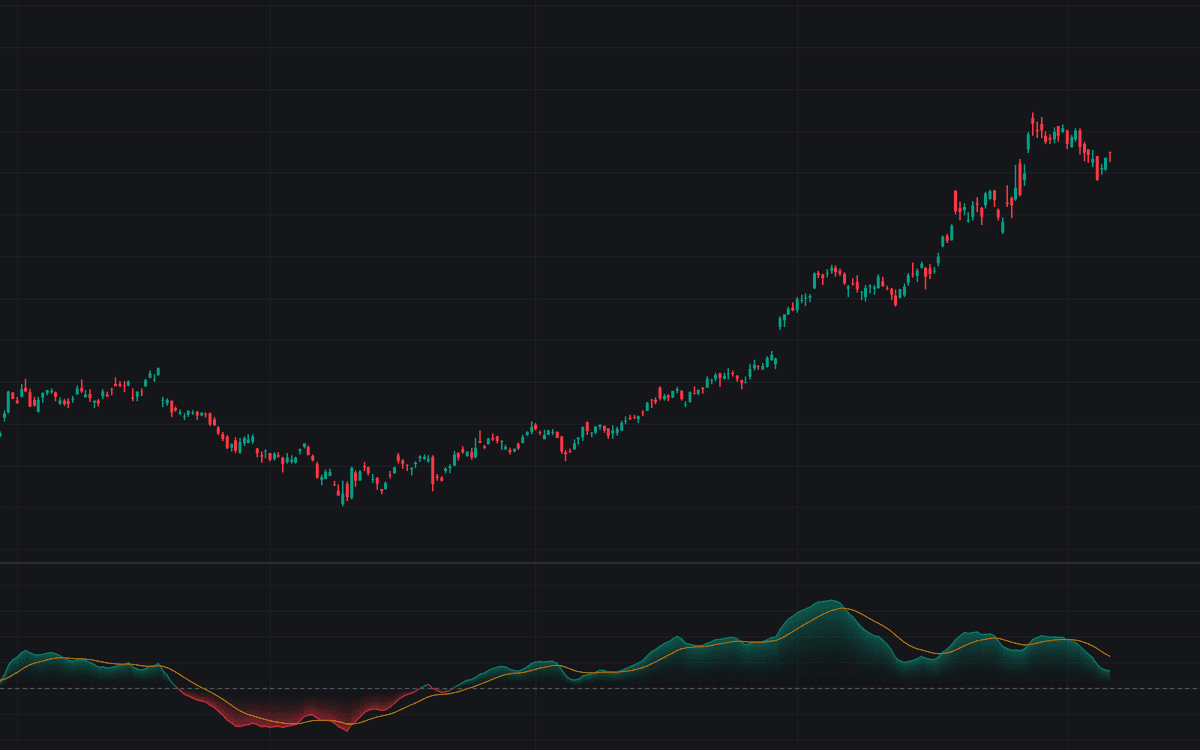

The True Strength Index (TSI) double-smooths one-bar price change and its absolute value with successive EMAs, then plots their ratio as a momentum oscillator centered on zero. William Blau's ratio asks how much of recent movement has been directional: the numerator keeps each bar's sign, the denominator strips it, bounding the line between +100 and -100 by design. This build reproduces the standard published calculation without modification, using the classic 25 and 13 smoothing lengths with a 13-period EMA signal line and a dashed zero line.
How to Trade the True Strength Index?
- TSI above zero: smoothed up momentum outweighs down momentum, the regime read favoring longs.
- TSI below zero: sustained stretches below zero define the bearish regime.
- TSI crossing above the Signal line: the timing trigger, earlier and less reliable than zero crosses; many honor only crosses agreeing with the zero-line side.
- TSI crossing below the Signal line: the mirror trigger, filtered the same way.
- Divergence at extremes: the deep smoothing yields clean swings, so higher-low and lower-high comparisons against price are easy to mark.
The same smoothing sets the cost: the line turns after price, and in ranges small oscillations around zero flip the sign without saying much.
True Strength Index Settings
- Long Length (default 25): the first (long) EMA applied to the one-bar price change; it does the heavy filtering. Raising it steadies the line and deepens the lag.
- Short Length (default 13): the second (short) EMA applied to the long-smoothed change, shaping response within the filter.
- Signal Length (default 13): the EMA of TSI forming the signal line; shorter trades cross quality for speed.
Alerts
Four alert conditions: TSI crossing above or below its signal line, and above or below the zero line.
Frequently Asked Questions

The Library is free. Quant makes it yours.
Pull any concept or indicator into Quant: rebuild it, retune it, or turn it into a backtested strategy of your own.