Concept
True Strength Index
True Strength Index is a Momentum & Oscillators concept. The Library holds 1 implementation, a working definition you can pull into Quant.
TSI
The standard True Strength Index indicator
True Strength Index exactly as classically defined: the faithful reference build of the original formula, free to run in Quant.
What is the True Strength Index?
The True Strength Index (TSI) is a momentum oscillator introduced by William Blau. It starts from one-bar momentum (each close minus the prior close), smooths that series twice with EMAs (commonly 25-period, then 13-period), and divides the result by the same double smoothing applied to the absolute value of the one-bar change. Because that denominator can never be smaller than the absolute value of the numerator, the ratio stays within -1 to +1; multiplied by 100, the output runs between +100 and -100, with zero marking the point where up and down momentum balance.
The ratio is the point of the design: the numerator keeps the sign of price changes while the denominator measures their total size, so TSI reads as net directional momentum as a share of total movement. The deep double smoothing was Blau's device for stripping bar-to-bar noise while keeping the line responsive enough to mark turns, and it gives TSI a smoother trace than most single-smoothed oscillators at comparable settings.
Blau introduced the index in Technical Analysis of Stocks & Commodities in the early 1990s and developed it at length in his 1995 book Momentum, Direction, and Divergence, where it anchors his family of double-smoothed "ergodic" designs; paired with its signal line, essentially the same construction circulates on many platforms as the Ergodic Oscillator. The bounded scale invites fixed reference levels, and charting packages commonly draw overbought and oversold guides near +25 and -25. Those defaults are conventions rather than properties of the math: a strongly trending market can hold beyond a guide for weeks, while a quiet one may never reach it.
The double smoothing that gives the line its clean swings also sets its limits. TSI turns after price, and the deeper the smoothing, the later the turn, so its crosses concede the first stretch of every reversal. Around zero in a rangebound market the line loses meaning: up and down momentum are nearly balanced, and small oscillations flip the sign without saying anything about the next move. The bounded scale also compresses extremes; readings near the theoretical limits essentially never occur, so the practical range is market-specific and worth measuring before any level-based rule is trusted.
How to identify True Strength Index signals on charts
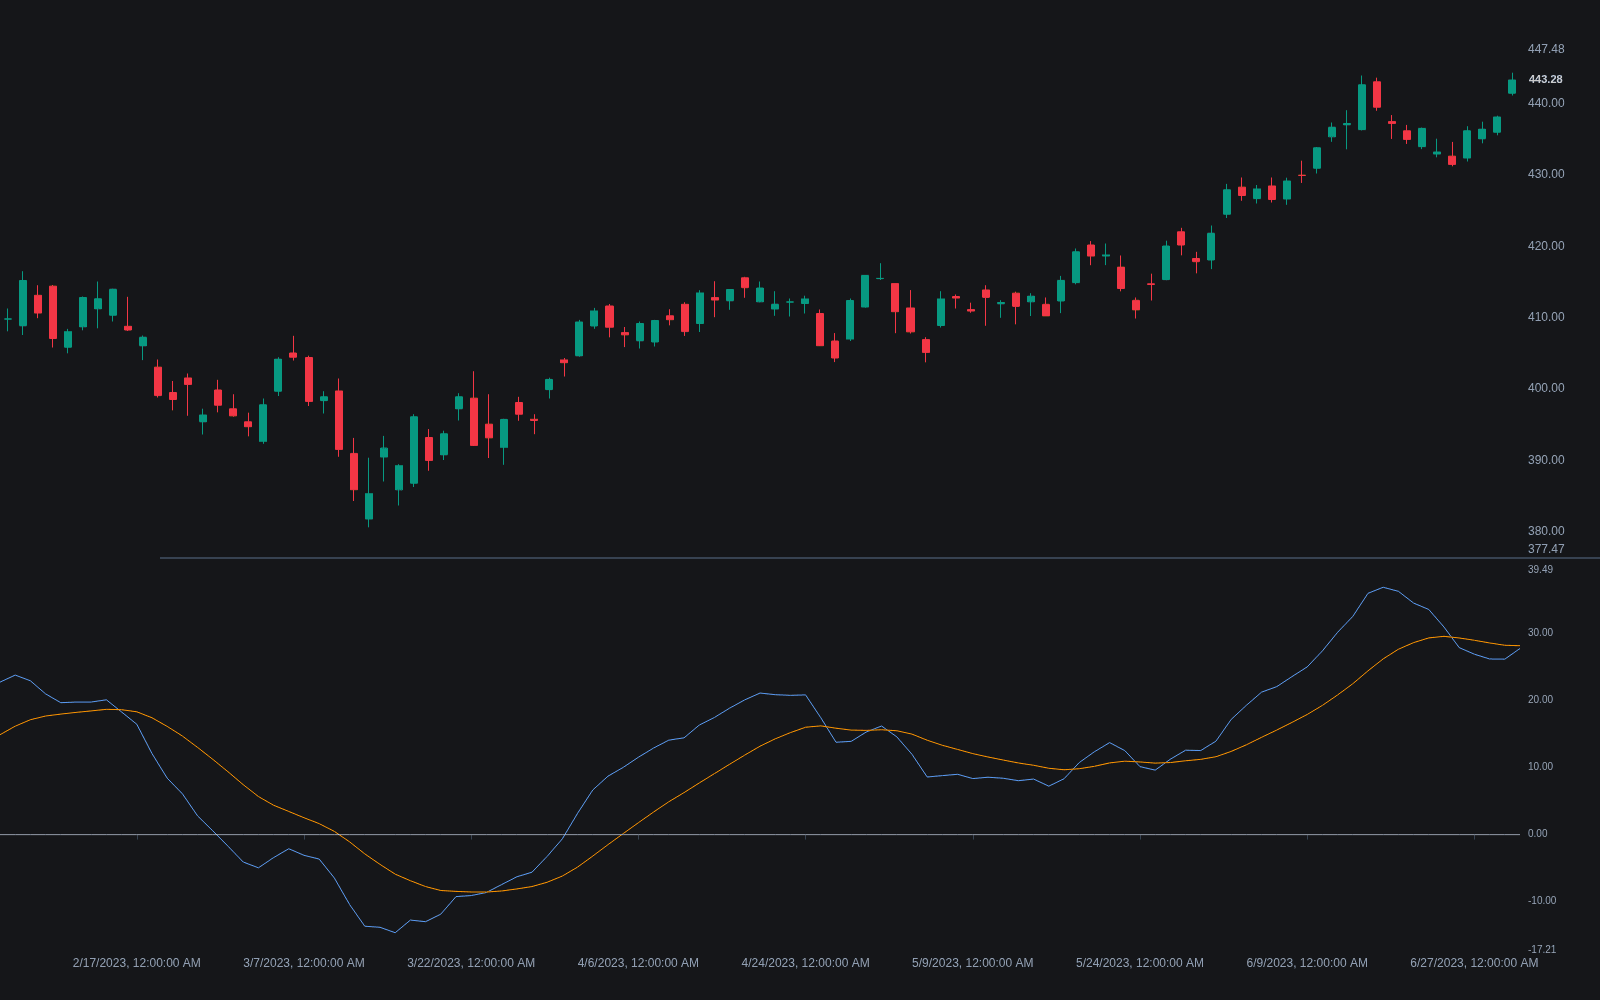
TSI plots in a subpanel between +100 and -100 with a zero centerline and usually a signal line. The useful reads are the sign, the crosses, and the line's swings against price.
- 1Apply the standard 25/13 smoothing with a 7 to 13 period signal EMA, and check how wide the line's actual range has run on your market; that range calibrates any overbought or oversold guides you draw.
- 2Read the zero line as the regime divide: sustained positive values mean smoothed up momentum dominates over the lookbacks, sustained negative values the reverse.
- 3Mark signal-line crosses for timing, expecting them to fire earlier and fail more often than zero crosses; many users take only the crosses that agree with the zero-line side.
- 4Scan swing highs and lows against price at extremes for regular divergence, and pullbacks within trends for hidden divergence; the smooth trace makes both easier to mark than on choppier oscillators.
- 5Confirm the settings against your holding period: shorter smoothing suits swing timing, longer suits position bias, and the same numbers rarely transfer across markets without testing.
How it's calculated
TSI is double-smoothed price change expressed as a percentage of double-smoothed absolute price change, a momentum oscillator bounded by -100 and +100.
William Blau's defaults are r = 25 then s = 13; the absolute-momentum denominator keeps TSI between -100 and +100.
Order matters: the long EMA is applied first, then the short one.
Zero-line crosses track the sign of smoothed momentum; TSI/signal crossovers are the usual trigger.
How traders use it
- As a zero-line regime filter: TSI above zero means smoothed up momentum exceeds down momentum over the lookbacks, and many systems only take longs on the positive side and shorts on the negative side.
- As a signal-line system: crossing TSI with a short EMA of itself (often 7 to 13 periods) gives MACD-style timing crosses.
- As a divergence tool: because the line is smooth, its swing highs and lows are well defined, which makes divergences against price easier to mark than on choppier oscillators.
- As a calibrated overbought/oversold gauge: conventional guides sit near +25 and -25, but percentile levels from the instrument's own TSI history are more defensible, acted on only when structure or a signal cross agrees.
- As the momentum leg of a small stack: because TSI normalizes by total movement, it can disagree with range-location tools like the stochastic oscillator after gaps or one-sided runs, and agreement between the two frames a stronger claim than either alone.
True Strength Index vs other momentum oscillators
RSI: Both normalize momentum to a bounded scale, but RSI ratios average gains against losses around a 50 midline, while TSI double-smooths signed change against absolute change around zero. TSI plots smoother at comparable settings; RSI's 30/70 conventions are more widely watched.
MACD: MACD works in price units, so its amplitude drifts with the instrument's price and volatility, and no fixed overbought level is possible. TSI is bounded and comparable across instruments. Both pair with signal lines; MACD reacts to EMA separation, TSI to normalized momentum.
Stochastic Momentum Index: The SMI, another Blau design, double-smooths where the close sits inside the recent high-low range, so it reads location within a range. TSI reads the net direction of change. The two look alike on screen; the inputs differ enough that their divergences appear at different times.
Concept family
Momentum & Oscillators
91 concepts mapped · 91 in the Library
True Strength Index FAQ
Turn True Strength Index into a trading strategy.
Take the implementation from this page into Quant, then build on it, backtest it on real data, and keep refining it in conversation.