Volatility Estimators
 By LuxAlgoApr 13, 2020
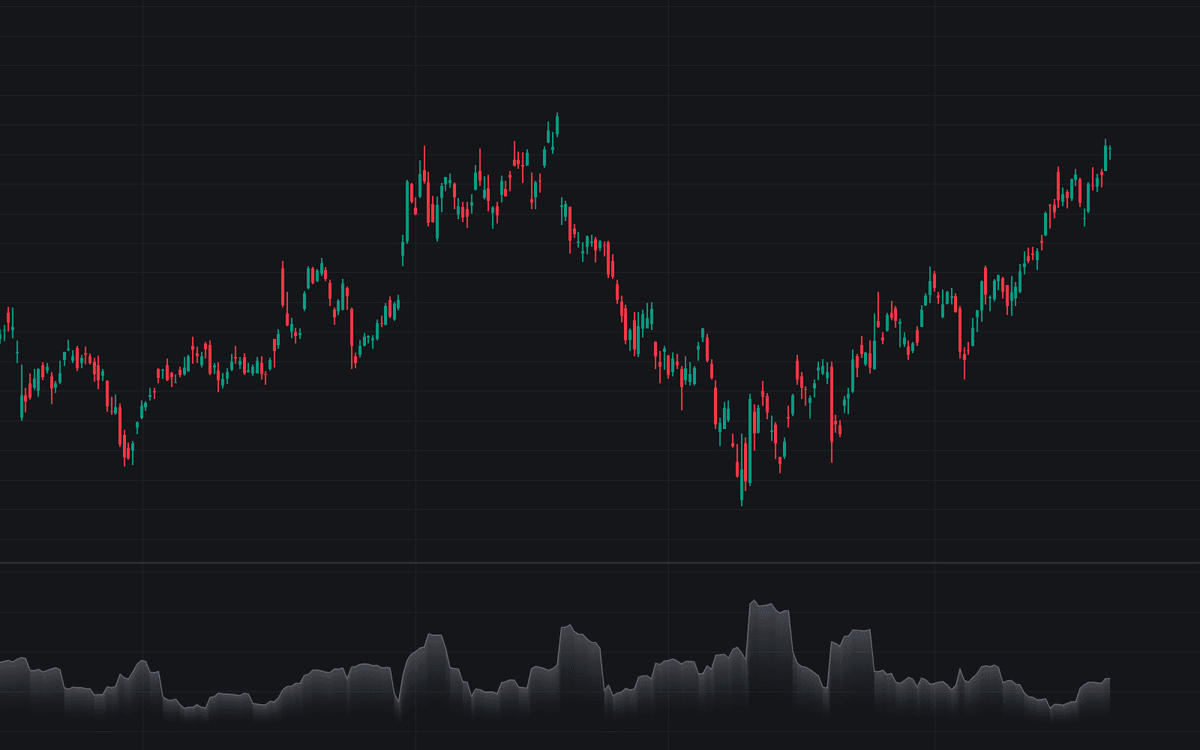

The Volatility Estimators indicator computes a chosen statistical volatility estimate over a lookback window and plots it as a single percentage line. A method selector covers five published estimators: Close-to-Close (the default), Zero-Trend, Parkinson, Garman-Klass, and Rogers-Satchell, with the range-based members drawing on each bar's high, low, open, and close rather than closes alone. Each is implemented in its standard published form over a default 10-bar window, with an annualize toggle scaling the per-bar figure by the square root of the periods per year.
How to Trade the Volatility Estimators?
- Rising line: realized volatility is expanding. Wider stops, smaller sizes, likelier breakout follow-through.
- Falling line: volatility compressing, a quieting regime favoring mean-reversion tactics and tighter targets.
- Low readings vs the instrument's own history: the compression squeeze traders watch. Quiet and expansive phases alternate.
- Estimator disagreement: a close-only estimate vs a range-based one (via a second instance) shows whether movement comes from close-to-close jumps or intrabar range.
A gauge, not a signal generator: it says how much the market is moving, never in which direction.
Volatility Estimators Settings
- Method (default Close-to-Close): the estimator plotted. Close-to-Close and Zero-Trend need only closes; Parkinson, Garman-Klass, and Rogers-Satchell fold in the bar's range, stabilizing on fewer bars at the cost of assuming no opening gaps.
- Length (default 10): bars in the estimation window; longer smooths, shorter reacts quickly but jitters.
- Annualize (default on): scales the per-bar estimate by the square root of the periods per year set in the adjacent field (default 252, the daily-bar convention); off plots raw per-bar values.
Frequently Asked Questions

The Library is free. Quant makes it yours.
Pull any concept or indicator into Quant: rebuild it, retune it, or turn it into a backtested strategy of your own.