Volatility of Volatility
 By LuxAlgoJun 20, 2026
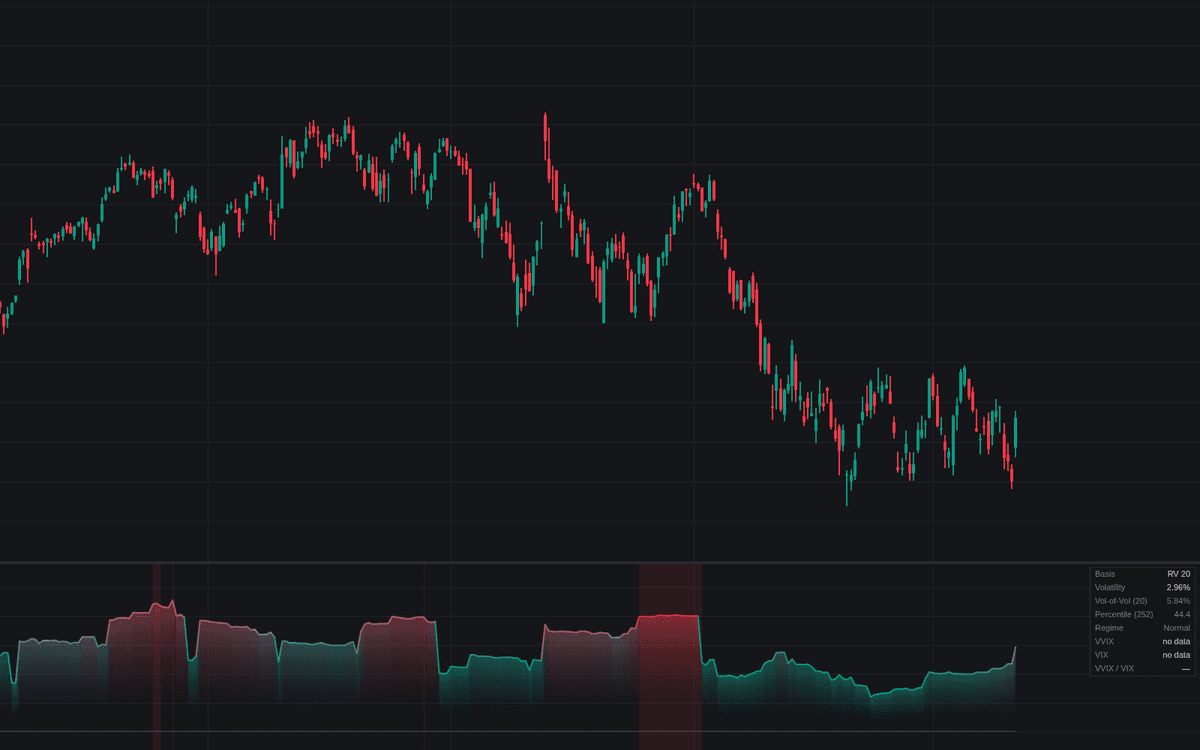

Volatility of Volatility answers the second-order question most volatility tools skip: how unstable is the volatility reading itself? The build differences a first-stage volatility series (realized volatility, ATR, or a published implied index), takes a rolling standard deviation of the changes, and percentile-ranks the result, since raw volatility of volatility readings do not transfer across instruments.
How to Trade the Volatility of Volatility?
- Unstable regime: at or above the 80th percentile the volatility estimate is on the move. ATR stops, volatility-targeted sizes, and fresh band widths go stale quickly; the background shades these stretches.
- Stable regime: at or below the 20th, trailing calibrations are at their most trustworthy, the footing quiet setups presume.
Volatility of Volatility Settings
- Volatility Basis (default Realized Volatility): the first-stage series; Implied Index reads Implied Index Symbol (default CBOE:VIX).
- Volatility Length (default 20): first-stage window; ignored for an implied index.
- Change Basis (default Log Change): scale-free log changes, or Simple Change in the series' own units.
- Vol-of-Vol Length (default 20): the second-stage standard-deviation window.
- Percentile Lookback (default 252) with High Percentile (default 80) and Low Percentile (default 20): the one-year ranking window and its regime cuts.
- VVIX / VIX Comparison (default enabled) with VVIX Symbol (default CBOE:VVIX) and VIX Symbol (default CBOE:VIX): dashboard rows for the listed implied counterpart.
- Show Percentile Levels (default disabled), Show Dashboard, Gradient Fill, and Highlight Unstable Regime (default enabled): the reference levels, stats panel, fill, and regime shading.
Frequently Asked Questions

Original indicatorBuilt in-house by LuxAlgo
The Library is free. Quant makes it yours.
Pull any concept or indicator into Quant: rebuild it, retune it, or turn it into a backtested strategy of your own.