Concept
Volatility of Volatility
Volatility of Volatility is a Volatility concept. The Library holds 1 implementation, a working definition you can pull into Quant.
Top Volatility of Volatility indicator
The top custom implementation, built on the original standard Volatility of Volatility formula.
1 total
From studying Volatility of Volatility to trading it: take the implementation below into Quant and backtest it instantly.
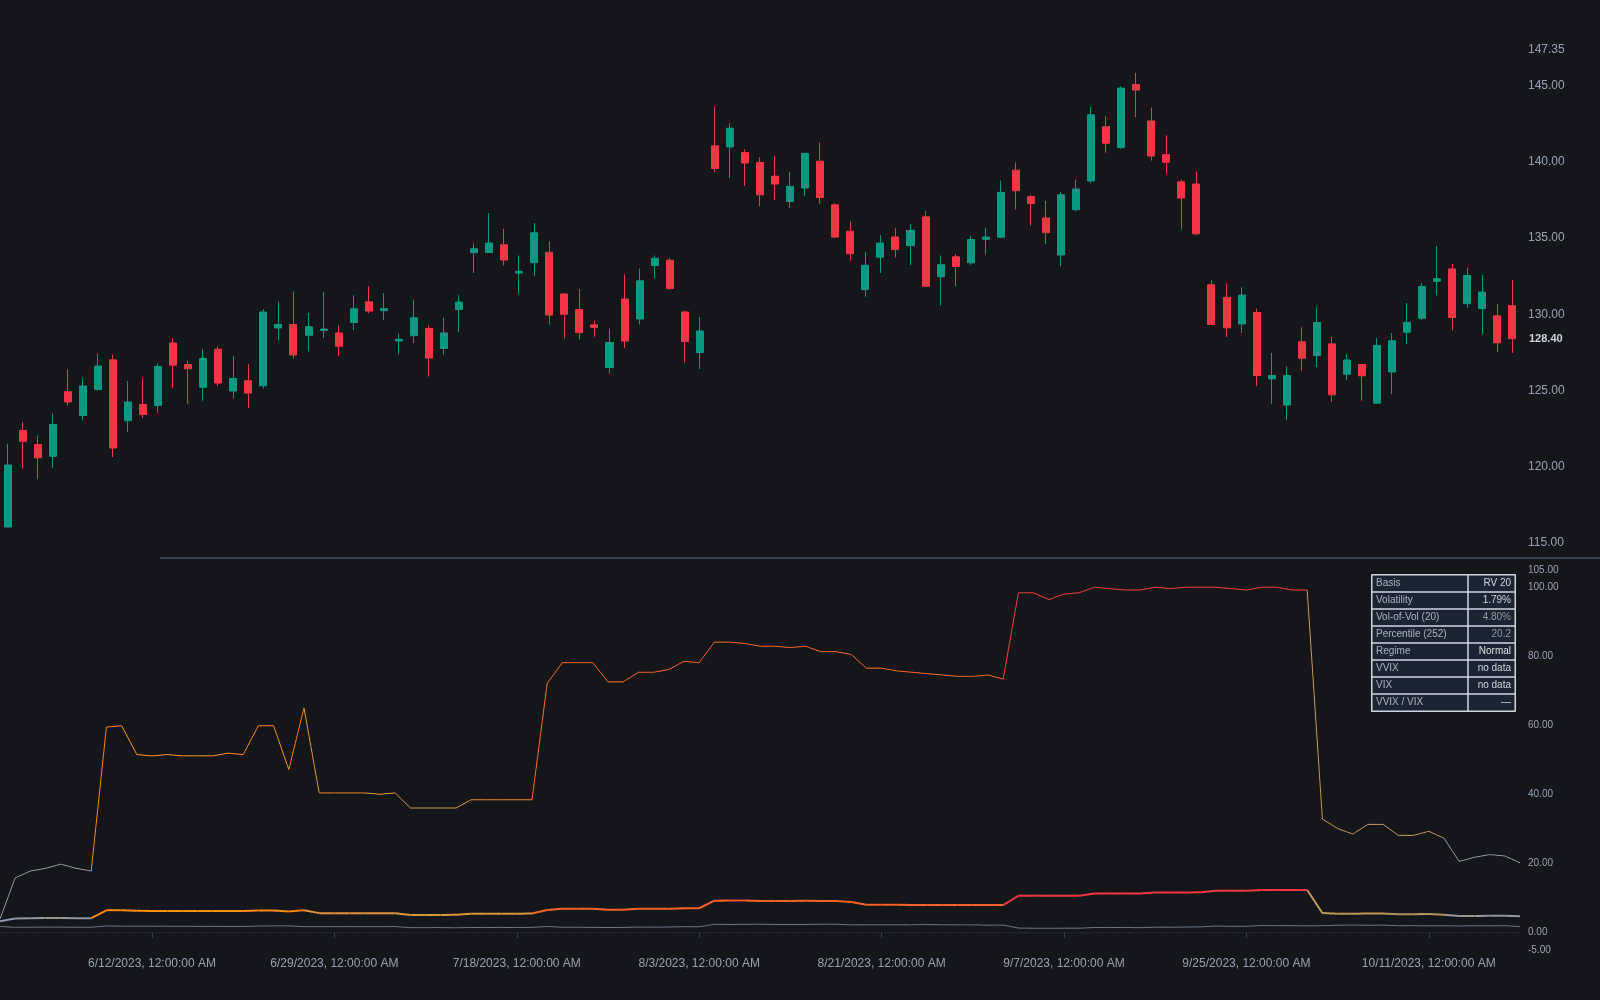
What is Volatility of Volatility?
Volatility of volatility (vol-of-vol) is second-order volatility: a measure of how unstable the volatility series itself is. Compute a volatility measure first, such as realized volatility, ATR, or an implied index, then apply a dispersion calculation to that series rather than to price. Two markets can carry the same average volatility while one holds it steadily and the other lurches between calm and panic; vol-of-vol is the number that separates them.
Options markets list the idea directly: VVIX measures the expected volatility of the VIX itself. High vol-of-vol means volatility estimates go stale quickly, which undermines anything calibrated to a trailing window: stop distances, position sizes, and band widths all inherit the instability.
The concept has formal roots in derivatives pricing. Stochastic-volatility models, of which Heston's 1993 model is the standard reference, treat volatility as a random process with its own volatility parameter, and options desks have priced and hedged that parameter for decades. Cboe brought the idea to public screens with VVIX, which applies VIX-style methodology to VIX options. Technical traders borrowed it because the practical problem is identical at every scale: yesterday's volatility estimate is only useful if volatility is somewhat sticky.
On a chart, vol-of-vol shows up as instability in everything volatility-driven: ATR that lurches instead of drifting, Bollinger Bands whose BandWidth whips open and shut, and compression signals that fire and fail in quick succession. Measuring it directly, as a dispersion statistic on the volatility series, replaces that visual impression with a number that can be tracked, ranked against its own history, and used as a condition.
How to measure volatility of volatility
The measurement is a two-stage calculation: estimate volatility, then measure the estimate's instability.
- 1Build the first-order series: rolling realized volatility, ATR, or an implied index if one exists for the market.
- 2Convert to changes: work with period-to-period changes or log changes of the volatility series so its level does not dominate the statistic.
- 3Apply a dispersion measure: a rolling standard deviation of those changes over a chosen window is the common choice.
- 4Normalize for context: a volatility percentile treatment of the result shows whether current instability is unusual for the instrument.
- 5For US index volatility, compare with VVIX, the published implied measure of the VIX's own expected movement.
How it's calculated
Second-order volatility: a dispersion measure applied to a volatility series itself instead of to price.
Any volatility series can feed the second stage: realized volatility as above, ATR, or an implied index; simpler versions take the standard deviation of Vol itself rather than of its log changes.
Multiply by sqrt(252) to annualize daily readings at either stage.
VVIX is the listed, option-implied counterpart: the VIX methodology applied to options on VIX.
How traders use it
- As a stability check on risk inputs: rising vol-of-vol warns that volatility-targeted sizing and volatility-scaled stops are calibrated to a number that keeps moving.
- As regime context: spikes in vol-of-vol often accompany transitions between calm and stressed conditions, so some regime models track it alongside the volatility level itself.
- In options analysis: VVIX elevated relative to VIX flags expensive volatility convexity, which some traders read as hedging demand.
- As a band-reading caveat: when vol-of-vol runs high, Keltner Channel and Bollinger widths become moving targets, so traders lean on structure or add buffer rather than trusting freshly recalculated band distances.
- As a squeeze filter: compression setups such as the TTM Squeeze presume a stable quiet phase, and some traders discount squeeze signals that form while the volatility series itself is thrashing.
Volatility of volatility vs first-order measures
Realized Volatility: Realized volatility measures how much price moves; vol-of-vol measures how much that measurement moves. The first sizes risk, the second says how far the sizing can be trusted before it needs revisiting.
Volatility Percentile/rank: Percentile locates today's volatility within its own history: it answers where the level sits, not how erratically it got there. A mid-percentile market can carry violent vol-of-vol during a regime transition, and the two readings together say more than either alone.
BandWidth: BandWidth is a chart proxy for the volatility level. The choppiness of the BandWidth line itself is an informal vol-of-vol read, which a dispersion calculation on the volatility series makes explicit and comparable over time.
Concept family
Volatility
57 concepts mapped · 57 in the Library
Volatility of Volatility FAQ
Turn Volatility of Volatility into a trading strategy.
Take the implementation from this page into Quant, then build on it, backtest it on real data, and keep refining it in conversation.