Vortex Indicator
 By LuxAlgoApr 13, 2020
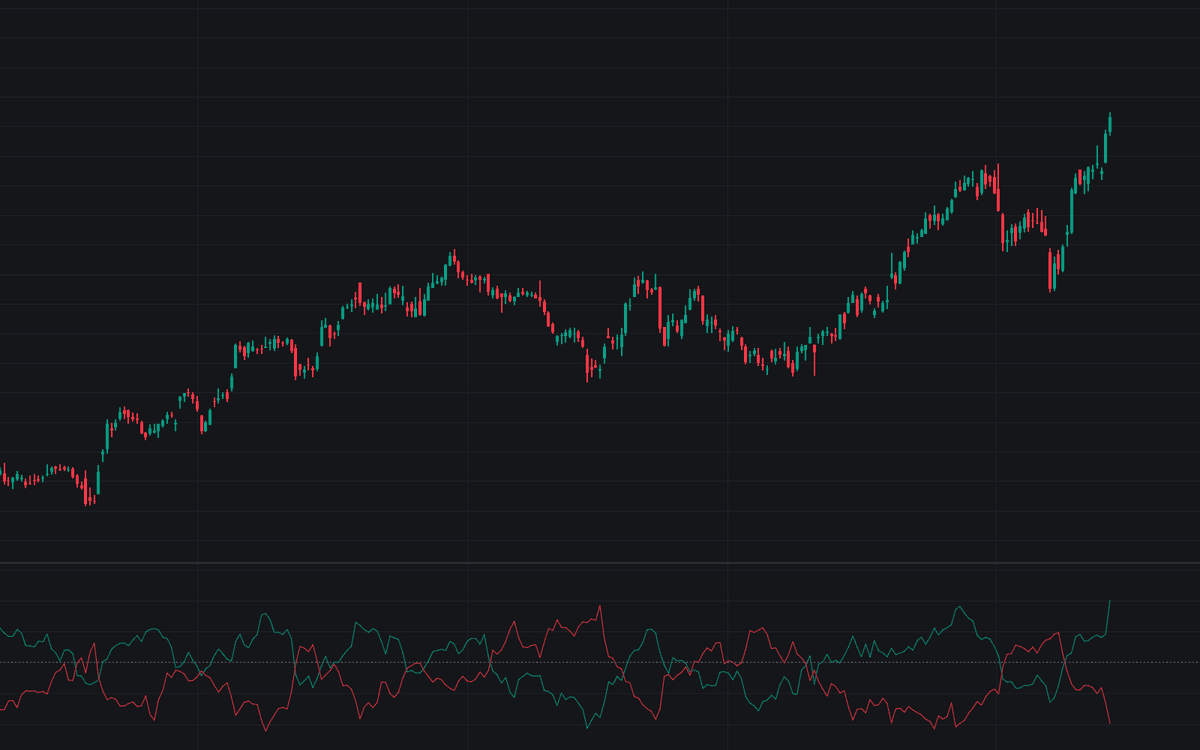

The Vortex Indicator tracks directional movement through two paired lines: VI+ sums the absolute distances from each bar's high to the prior bar's low over the lookback, VI- sums the distances from each low to the prior high, and both sums are divided by the total true range over the same window. Upward bar-to-bar reach feeds VI+, downward reach feeds VI-, and the normalization keeps the pair comparable across volatility regimes. Etienne Botes and Douglas Siepman published the design in 2010; this is a straight implementation of the standard calculation with the classic 14-bar length, plotted with a dotted baseline at 1.
How to Trade the Vortex Indicator?
- VI+ crossing above VI-: upward reach has overtaken downward reach, the bullish cross arguing the uptrend has the upper hand.
- VI+ crossing below VI-: the bearish cross, handing the argument to the downtrend.
- Wide separation between the lines: the gap plays the strength role. The wider the spread, the more one-sided recent reach has been.
- Both lines braided around the Baseline: reach and range in balance on both sides. Indecision, and the conditions in which crosses degrade into noise.
The pair applies no smoothing, which is a deliberate temperament choice: crossovers arrive faster than on the Wilder-smoothed DMI family and whipsaw more in ranges. Practice compensates externally: a higher-timeframe bias, or a requirement that the crossing line hold above 1 before the signal is honored.
Vortex Indicator Settings
- Length (default 14): the number of bars over which the vortex movements (VM+ and VM-) and the true range are summed. Lengthening toward 21 calms whipsaw at the cost of later crosses; shortening speeds the crosses and multiplies the false ones.
Frequently Asked Questions

The Library is free. Quant makes it yours.
Pull any concept or indicator into Quant: rebuild it, retune it, or turn it into a backtested strategy of your own.