Concept
Vortex
Vortex is a Trend concept. The Library holds 1 implementation, a working definition you can pull into Quant.
VI+/VI−
The standard Vortex indicator
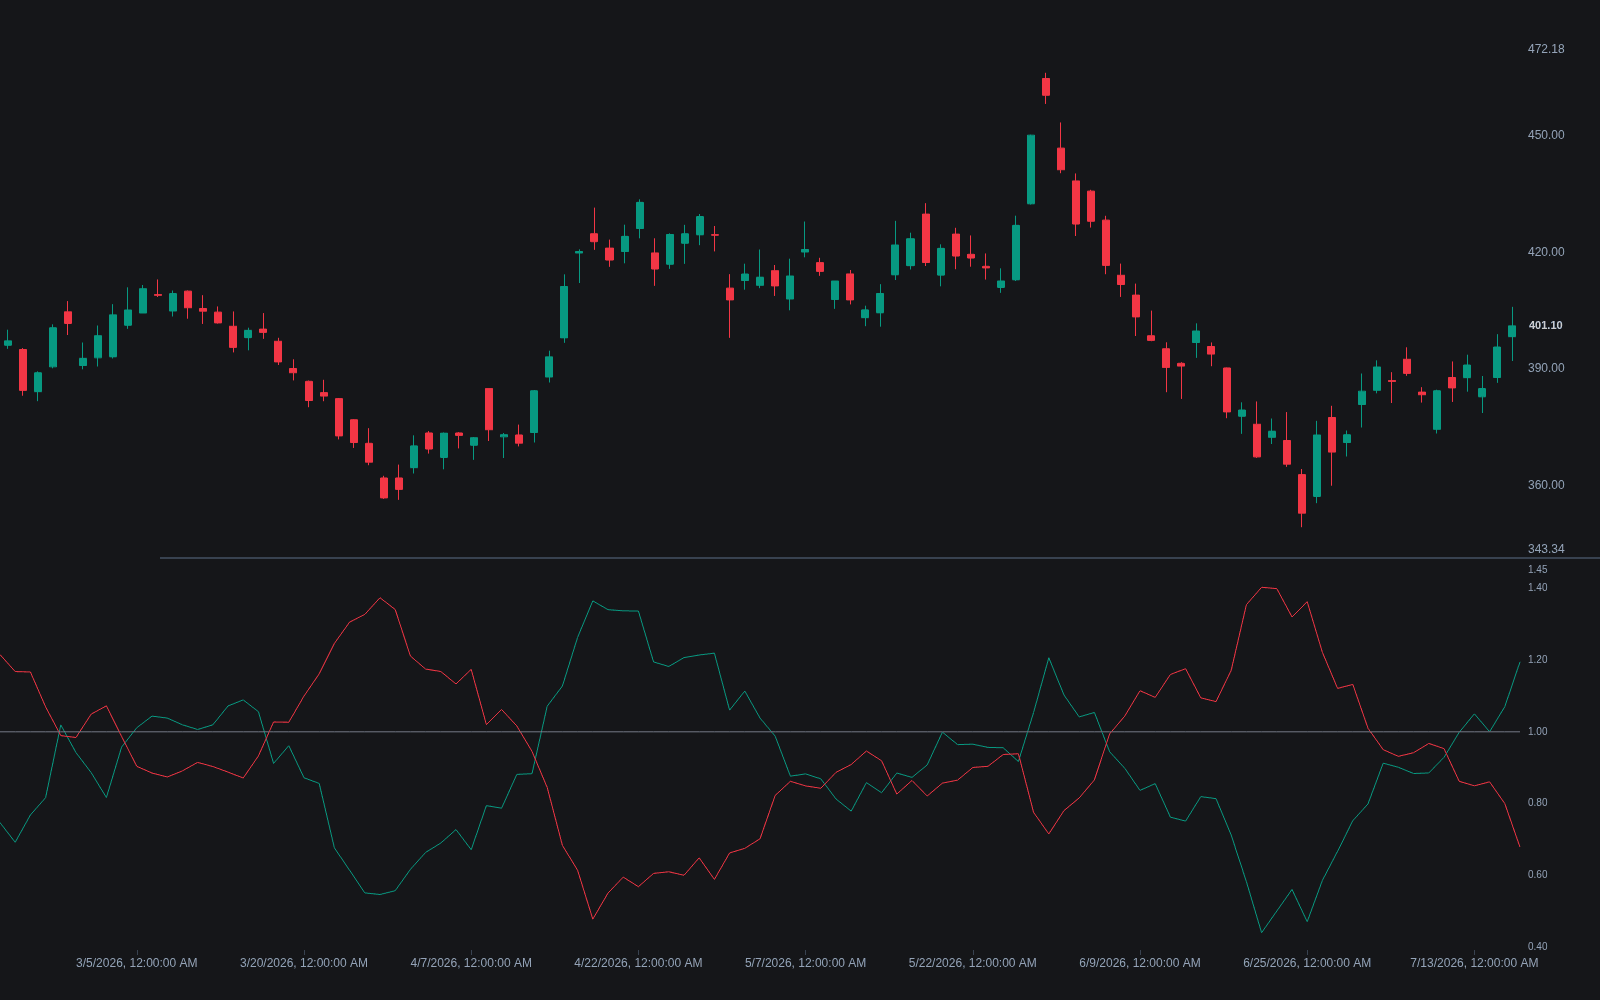
Vortex exactly as classically defined: the faithful reference build of the original formula, free to run in Quant.
What is the Vortex Indicator?
The Vortex Indicator (VI) is a two-line trend tool published by Etienne Botes and Douglas Siepman in 2010, named for an analogy to vortex flows observed in nature. The positive line, VI+, sums the absolute distances from each bar's high to the prior bar's low over the lookback; the negative line, VI−, sums the absolute distances from each bar's low to the prior bar's high; both sums are divided by the total true range over the same window, with 14 periods a common default. Upward bar-to-bar reach feeds VI+, downward reach feeds VI−, and the normalization keeps the pair comparable across volatility regimes.
Signals are read from the pair: VI+ crossing above VI− argues the uptrend has the upper hand, the opposite cross argues for the downtrend, and wide separation is taken as trend strength while braided, overlapping lines mark chop. It occupies the same niche as the ADX/DMI system but derives direction from bar-to-bar reach rather than Wilder's directional movement, and because it applies no Wilder smoothing and has no separate strength line, its crossovers tend to arrive faster and whipsaw more in ranges.
The authors introduced the indicator in a Technical Analysis of Stocks & Commodities article, crediting the inspiration to vortex motion in water and air: an uptrending market, in their analogy, keeps reaching from each bar's high back over the prior bar's low, tracing an expanding spiral upward, and the indicator simply measures the two spirals against each other. The normalization detail matters more than the poetry: dividing by summed true range converts raw reach into a proportion, so a reading near 1.0 says that direction's reach has been running close to the entire range the market traded, which is why both lines hovering around 1.0 reads as pure indecision.
The lack of smoothing is a deliberate temperament choice, and practice compensates externally. Common mitigations include longer lookbacks around 21 bars in choppy instruments, a light EMA pass over the lines, and demanding that a crossover coincide with a level condition, VI+ above 1.0 while VI− sits depressed, before honoring it. The Library's builds show the same instinct for reinforcement: pairings with a MACD histogram, with RSI, and as the directional gate inside a range-breakout system, each using the vortex pair for direction while something steadier vets the timing.
How to identify Vortex Indicator readings
Two sums, one normalization, and a small grammar of crossings, levels and separation.
- 1Compute per bar: positive vortex movement as the absolute distance from the current high to the prior low, negative as the distance from the current low to the prior high.
- 2Sum each series over the lookback, 14 bars classically, and divide both by the summed true range of the same window.
- 3Plot the pair: VI+ and VI− oscillating around the 1.0 area, where reach and range balance.
- 4Read crossings as direction-change candidates, separation as strength, and braided lines around 1.0 as chop to stand aside from.
- 5Filter the crossings: a higher-timeframe bias, a trend regime read, or a level requirement keeps range noise from spending your attention.
How it's calculated
Two lines, VI+ and VI-, that measure upward and downward trend strength from the reach between consecutive bars.
Introduced by Etienne Botes and Douglas Siepman in 2010.
Both lines oscillate around 1; VI+ crossing above VI- is read as the start of upward trend pressure, and the opposite cross as downward.
How traders use it
- As a trend-change trigger: crossovers of VI+ and VI− flag directional turns, usually filtered by a higher-timeframe bias or a smoothing pass because raw crosses are frequent in ranges.
- As a strength gauge: the spread between the lines, or one line holding at an elevated level, qualifies whether a trend is worth following.
- As confirmation for other systems, for example only honoring breakouts when the vortex pair already leans the same way.
- With level conditions: requiring VI+ to hold above the 1.0 area while VI− stays depressed, rather than trading bare crossings, converts the pair into a trend-hold condition that survives minor rotations.
- As the directional gate in breakout systems: range breaks are honored only when the vortex pair already leans in the break's direction, the construction used by the Library's vortex range-breakout build.
Vortex Indicator vs related trend tools
ADX/DMI System: Both pair directional lines built from bar-to-bar range logic. DMI adds Wilder smoothing and the ADX strength line, buying stability at the cost of speed; the vortex pair skips both, crossing faster and whipsawing more. Same niche, opposite temperament settings.
Supertrend: Supertrend outputs a stateful line that holds direction until price crosses an ATR band, a regime with memory. The vortex pair re-evaluates continuously and carries no ratchet, so it registers deterioration earlier while Supertrend ignores it longer. Gate versus gauge.
Moving Average Crossovers: MA crossovers compare two smoothed prices; vortex crossings compare two normalized reach sums. Both lag turns, but differently: averages lag by smoothing memory, vortex sums lag by window contents, and the vortex pair adds a strength read (separation) that a two-line MA cross lacks.
Concept family
Trend
100 concepts mapped · 100 in the Library
Vortex FAQ
Turn Vortex into a trading strategy.
Take the implementation from this page into Quant, then build on it, backtest it on real data, and keep refining it in conversation.