Williams %R
 By LuxAlgoApr 13, 2020
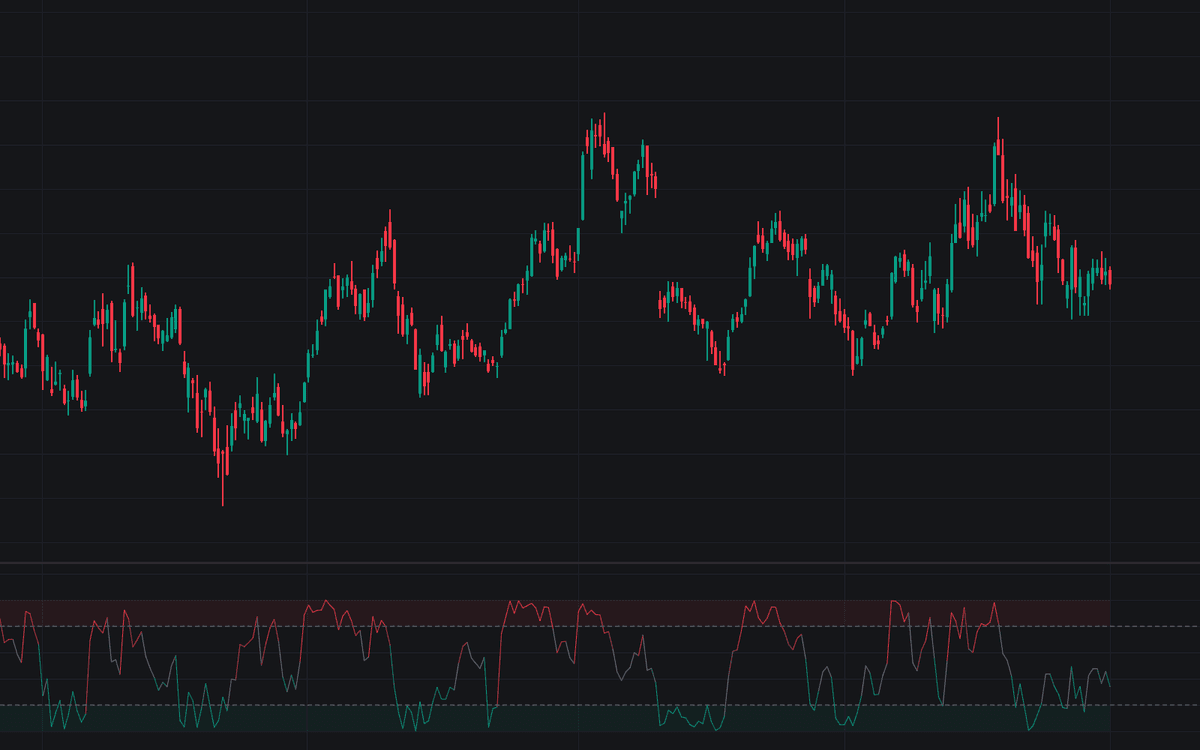

Williams %R plots where the current close sits relative to the highest high and lowest low of a lookback window, on an inverted 0 to -100 scale: readings near 0 mean closes at the very top of the recent range, near -100 the very bottom. The default length is 14, and this is the standard implementation of Larry Williams' %R with the classic settings: dashed reference lines at the -20 overbought and -80 oversold levels, with the area between them shaded.
The line is plotted raw, with no smoothing and no signal line, so it registers a shift in range position on the bar it happens, at the price of more noise.
How to Trade the Williams %R?
- %R above -20: overbought, closes near the ceiling of the lookback range. In a sideways market a fade condition; in a trend, evidence of strength.
- %R below -80: oversold, closes pinned to the floor of the range, the mirror image.
- Crosses back out of a zone: the hook back below -20 or above -80 is the classic timing trigger, acting as the extreme unwinds.
- Failures to reach a zone: a rally that no longer pushes %R above -20 shows closes stalling short of the range top, fading momentum.
Williams %R Settings
- Length (default 14): the lookback for the highest high and lowest low. Shorter windows visit the extremes constantly; longer ones make zone readings rarer.
- Source (default close): the series located within the range.
- Overbought Level (default -20) and Oversold Level (default -80): the zone boundaries. The dashed lines, shaded zone, and alerts all follow these inputs.
Williams %R Alerts
Four alert conditions cover both boundaries: Overbought Enter and Overbought Exit fire as %R crosses above and back below the overbought level; Oversold Enter and Oversold Exit track the same transitions at the oversold level.
Frequently Asked Questions

The Library is free. Quant makes it yours.
Pull any concept or indicator into Quant: rebuild it, retune it, or turn it into a backtested strategy of your own.