Concept
Williams %R
Williams %R is a Momentum & Oscillators concept. The Library holds 1 implementation, a working definition you can pull into Quant.
The standard Williams %R indicator
Williams %R exactly as classically defined: the faithful reference build of the original formula, free to run in Quant.
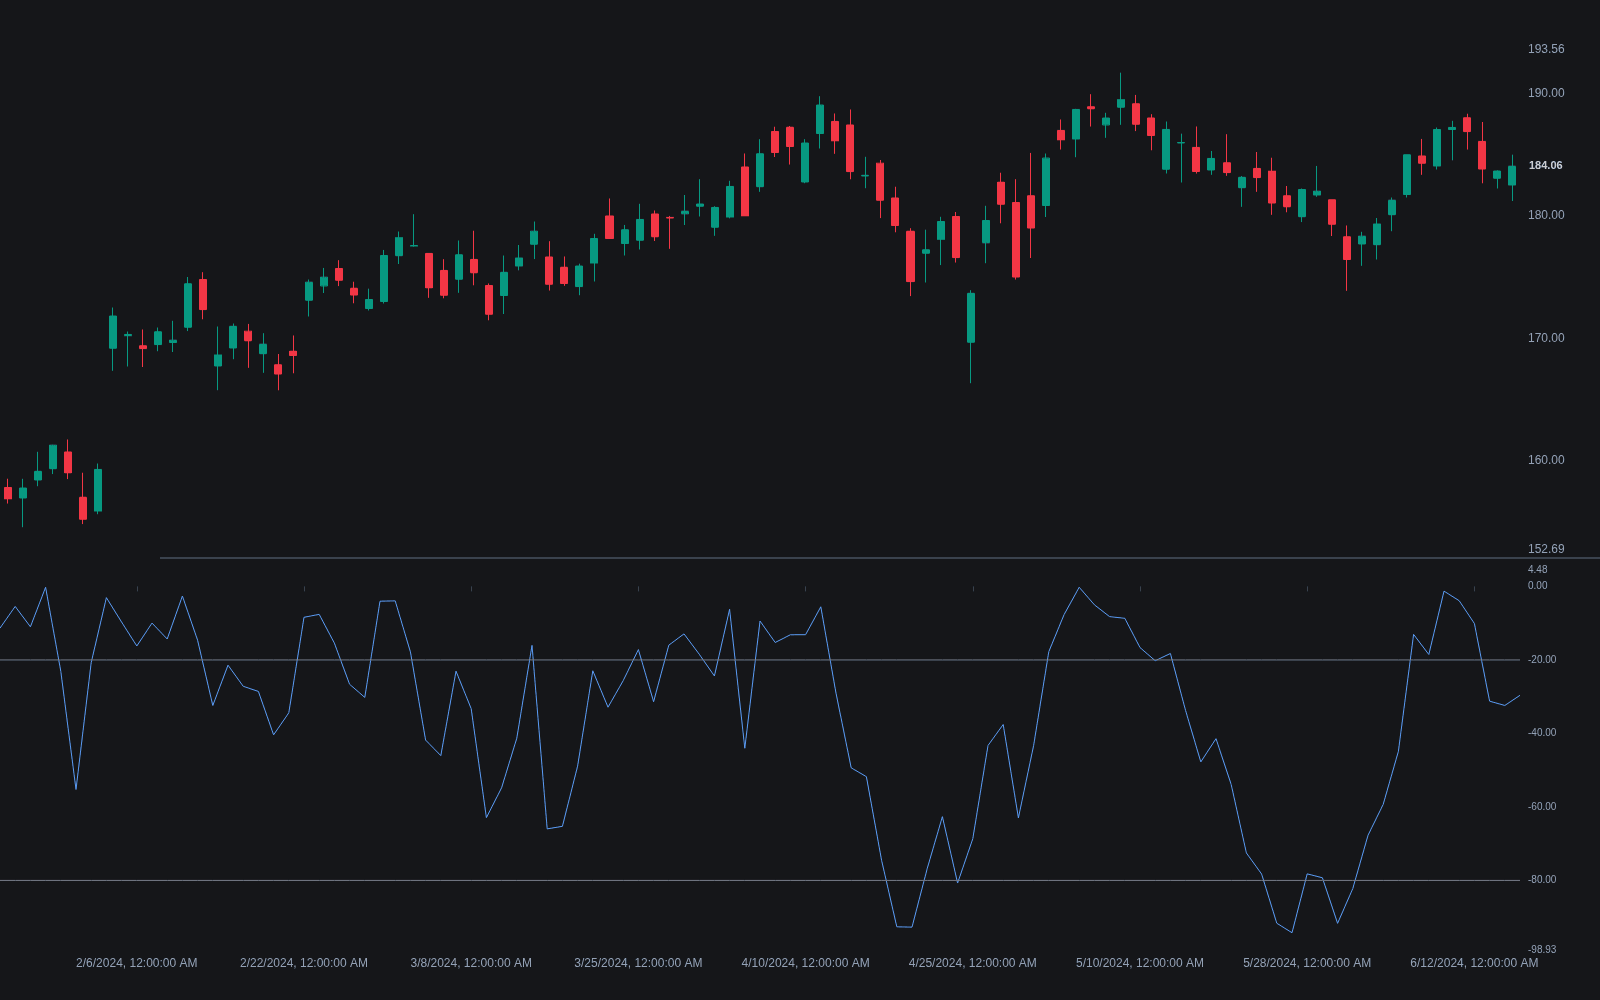
What is Williams %R?
Williams %R is Larry Williams' momentum oscillator measuring where the latest close sits inside the recent high-low range. It is computed as (highest high - close) divided by (highest high - lowest low) over a lookback window, 14 periods by convention, multiplied by -100. The scale runs from 0 (closing at the very top of the range) down to -100 (closing at the very bottom), with readings above -20 conventionally labeled overbought and readings below -80 oversold.
The oscillator is credited to Larry Williams, the futures trader and author, and dates from the early 1970s, spreading through his books and market writing. Early descriptions used a 10-day window; charting platforms later standardized on 14, the same default that took hold for RSI and the stochastic. The negative scale is a historical plotting convention rather than extra information, and some platforms display the axis as 0 to 100 with the sign dropped.
Mechanically it is the raw %K of the stochastic oscillator flipped onto a negative axis: %R equals %K minus 100. The practical difference is presentation and smoothing: %R is typically plotted raw with no signal line, so it reacts sooner than a slow stochastic and whipsaws more.
What a reading asserts is narrow and useful: it locates the latest close inside the recent high-low span, nothing more. That makes %R a fast, bounded expression of momentum in the range-location sense: closes migrating toward the top of the range are the signature of buying pressure, closes sagging toward the bottom the reverse. Because the scale is hard-bounded, %R pins to its extremes easily; a reading of -2 in a strong uptrend is normal, so the zones read best alongside trend context rather than as standalone triggers.
How to read Williams %R on a chart
%R plots in its own pane on a fixed 0 to -100 scale, so reading it is about zones and transitions rather than shapes.
- 1With the default 14-period lookback, mark the -20 and -80 reference lines: above -20 the close sits in the top fifth of the lookback range, overbought by convention; below -80, the bottom fifth, oversold.
- 2Establish the regime first: in a trending market expect %R to camp in one zone for long stretches, while in a range it oscillates between both.
- 3Watch transitions rather than levels: the hook back out of a zone, a failure to reach the far zone on a bounce, or oscillator extremes that no longer match price's extremes.
- 4Confirm against price structure or a slower gauge such as MACD before acting; %R alone is deliberately twitchy.
How it's calculated
Locates the latest close inside the highest-to-lowest range of the last n bars, on a 0 to -100 scale.
Developed by Larry Williams; the output is bounded between 0 and -100.
Readings above -20 are commonly treated as overbought and below -80 as oversold.
It is the Stochastic %K shifted: %R_t = %K_t - 100 for the same length.
How traders use it
- As an overbought/oversold gauge: extremes flag closes pinned to the edge of the range; in sideways markets these often precede fades, while in trends they can persist for many bars, so most workflows apply a trend filter before fading them.
- As a momentum-failure tell: in an uptrend, a rally that can no longer lift %R above -20 shows closes failing to reach the top of the range, the same weakening logic as a stochastic that stops reaching overbought.
- As a timing trigger inside a higher-timeframe trend filter: wait for %R to reach the oversold zone during an uptrend, then act on the hook back above -80 or a price trigger rather than the extreme reading alone.
- As a divergence tool: price making a new extreme while %R prints a shallower one sets up a regular bullish or bearish divergence read; the bounded scale compresses extremes, so many traders demand price confirmation before trading it.
- In multi-indicator combinations: library scripts pair %R with RSI and a moving average so the fast %R times entries that slower tools have already vetted, a division of labor that generalizes to other confirming gauges such as ROC.
Williams %R vs other momentum oscillators
Stochastic Oscillator: Raw %K and %R are the same number on different axes (%R = %K - 100). The stochastic convention adds smoothing and a %D signal line, so it fires later and cleaner; %R shows the unfiltered version.
RSI: RSI averages the magnitude of up closes against down closes, measuring the persistence of gains rather than position in a range. It moves more smoothly and pins to extremes less readily than %R, which reads only where the close sits in the recent range.
Stochastic RSI: Stochastic RSI applies the range-location formula to RSI values instead of price, an indicator of an indicator that reaches extremes even faster than %R. StochRSI is usually smoothed to stay usable.
CCI: CCI measures how far typical price has strayed from its own average in mean-deviation units and is unbounded, so it grades the size of an excursion. %R is hard-bounded and saturates at the extremes instead.
Concept family
Momentum & Oscillators
91 concepts mapped · 91 in the Library
Williams %R FAQ
Turn Williams %R into a trading strategy.
Take the implementation from this page into Quant, then build on it, backtest it on real data, and keep refining it in conversation.