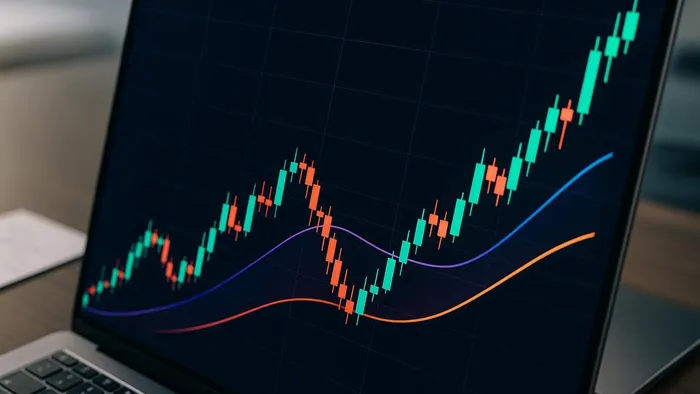

Master risk management in trading with effective position sizing techniques to protect your capital while pursuing growth.
Position sizing is the backbone of managing risk in trading. It determines how much capital you allocate to each trade, helping you protect your account from significant losses while still allowing for growth. Here’s the essence:
- Why It Matters: Position sizing ensures you don’t risk too much on a single trade, keeping your account safe from market volatility.
- Key Methods:
- Fixed Dollar Amount: Allocate a set dollar amount per trade.
- Percentage of Account Equity: Risk a fixed percentage of your total account value.
- Volatility-Based: Adjust position size based on market volatility using tools like ATR.
- Risk-Reward Ratio: Balance potential loss against expected gain.
- Common Mistakes: Ignoring volatility, overconfidence after wins, or increasing positions mid-trade can lead to losses.
- Practical Steps: Define your risk tolerance, calculate risk per unit, and determine position size using a straightforward formula.
Effective position sizing isn’t about making every trade a win – it’s about staying consistent and disciplined over time. LuxAlgo provides trading indicators and AI backtesting on TradingView and the web to help refine your strategy with data-driven insights and backtesting. Explore the main site and the Indicator Library for free indicators.
The ONLY Position Sizing Guide You'll EVER Need!
4 Core Position Sizing Methods
Position sizing is a key element of successful trading. It helps you manage risk and make the most of your trades without overextending yourself. Below, we'll break down four core methods for determining position size. Each has its strengths and is suited to different trading styles and situations. These methods will lay the groundwork for a detailed step-by-step guide later.
"Position sizing is the glue that holds together a trading system. It ensures you don't over-leverage or under-commit in any single trade, helping you stay in the game long enough to let your edge play out over a series of trades."
- Brijesh Bhatia, Equity Capital Market Analyst at Definedge [External]
Fixed Dollar Amount Method
This method is as straightforward as it gets. You allocate a fixed dollar amount to every trade. For example, you might decide to invest $1,000 in each trade, whether you're buying a pricey stock at $180 per share or a more affordable one.
While this approach is simple, it has its limits. As your account grows, that $1,000 becomes a smaller fraction of your total capital. This means you might not fully leverage your increased buying power. Additionally, this method doesn’t account for the varying risk or volatility of different assets.
Percentage of Account Equity Method
The Percentage of Account Equity Method scales with your account size. Here, you risk a fixed percentage of your total account value on each trade. For example, many traders stick to risking 1% to 2% of their account per trade. See a deeper overview of position sizing concepts here.
If you have a $50,000 account and risk 2%, each trade would put $1,000 at risk. As your account grows to $75,000, your risk per trade increases to $1,500. This method adjusts automatically as your account value changes, but it doesn't factor in market volatility, which can still leave you exposed to unexpected swings.
Volatility-Based Position Sizing
This method takes market volatility into account. By using tools like the Average True Range (ATR), you can size your positions based on how much an asset typically moves. The idea is simple: reduce your exposure in volatile markets and increase it when conditions are calmer.
Let’s say you have a $100,000 account and are willing to risk 0.5% per trade, or $500. If a stock is trading at $20 with an ATR of $0.50, you could buy 1,000 shares and set your stop-loss $0.50 below the entry price. This caps your risk at $500. In more volatile conditions, this method helps you control losses by automatically reducing your position size.
"Volatility is a good friend to the patient, value-driven investor."
- David Rolfe [External]
Risk-Reward Ratio Analysis
The Risk-Reward Ratio Analysis method focuses on weighing your potential loss against your expected gain. Before entering a trade, you define your risk-reward ratio and adjust your position size accordingly. Learn the differences between risk/reward and win rate in LuxAlgo’s overview here.
For example, scalpers, day traders, and swing traders often aim for risk-reward ratios of 1:1.5, 1:2, or 1:3, respectively. If you buy 100 shares at $20, set a stop-loss at $15, and aim for a target price of $30, you’re risking $5 per share to potentially gain $10 – a 1:2 risk-reward ratio.
Finding Your Fit
The best position sizing method depends on your trading experience, risk tolerance, and the market environment. Beginners often start with simpler methods like the Fixed Dollar or Percentage of Account Equity approaches. As you gain confidence and skill, transitioning to more advanced techniques like Volatility-Based Sizing or Risk-Reward Analysis can help refine your strategy. The key is consistency – choose a method you can stick with over the long term.
How to Calculate Position Size: 3-Step Process
Here’s a simple three-step method to figure out your position size while keeping your risk tolerance and market conditions in check.
Step 1: Define Your Risk Tolerance
The first step is understanding how much you’re willing to lose on a single trade without it affecting your financial stability or peace of mind. This is your risk tolerance. A widely used rule of thumb is to risk no more than 2% of your trading capital on any given trade [External]. For instance, if you have a $50,000 account, you’d risk a maximum of $1,000 per trade. However, this percentage isn’t set in stone. Beginners might prefer to stick with 0.5% to 1% until they feel more confident, while experienced traders may go up to 2–3%. The key is to pick a percentage you can stick to consistently, even when the market gets volatile.
Step 2: Determine Risk Per Unit
Once you’ve established your risk tolerance, the next step is to calculate how much you’re risking on each share or contract. This is done by subtracting your stop-loss price from your entry price:
Risk per unit = Entry price – Stop-loss price
For example, if you’re buying Apple stock at $180 per share and set a stop-loss at $175, your risk per share is $5. This step is critical because it defines where you’ll exit the trade if the market moves against you. When setting stop-loss levels, consider technical indicators or market volatility. If you’re trading options, the premium paid per contract serves as your risk per unit.
Step 3: Calculate Your Position Size
Now, divide your maximum risk per trade by your risk per unit to determine the number of shares or contracts you should trade:
Position size = Maximum risk per trade ÷ Risk per unit
Let’s break it down with an example: If your maximum risk is $1,000 and your risk per share is $5, you can buy 200 shares. This ensures that if the stock hits your stop-loss, your loss will be limited to $1,000.
Another example: If you’re trading Tesla at $250 per share with a $10 risk per share and a $1,000 maximum risk, your position size would be 100 shares. This keeps your potential loss at $1,000 if the trade doesn’t go your way.
Remember, a tighter stop-loss means a smaller position size, while a wider stop-loss allows for a larger position – both staying within your risk limits. For help finding levels, browse LuxAlgo’s Fibonacci Trailing Stop or Market Structure Trailing Stop.
Using LuxAlgo Tools for Better Position Sizing
When it comes to refining your trading strategy, having reliable, data-driven tools can make all the difference. LuxAlgo provides TradingView toolkits and an AI Backtesting platform designed to enhance your entry and exit decisions, ensuring your position sizing strategy is both precise and well-informed.
Finding Entry and Exit Points with LuxAlgo Indicators
Getting your position sizing right starts with accurate entry and exit points. LuxAlgo’s Price Action Concepts (PAC) and Signals & Overlays (S&O) toolkits provide actionable insights to guide your decisions.
For example, the Internal Pivot Pattern and Internal Candle Strength indicators help locate pivots and assess candle strength, supporting tighter stop-losses at critical moments. Browse related tools in the Indicator Library and trend tools like Trend Starter and Trend Starter. For exit logic, explore Trend Starter or this trend resource, and study Oscillator Matrix for confluence and market structure.
Testing Position Sizing Strategies with LuxAlgo’s AI Backtesting Assistant
Once you've identified clear entry and exit signals, it’s essential to test your approach against historical data. LuxAlgo’s AI Backtesting Assistant lets you do just that, offering access to millions of unique strategies. You can try out different position sizing methods across various timeframes to match your trading style .
By inputting your position sizing method into the platform, you can analyze past performance and make adjustments based on historical trends. The Ultimate plan, priced at $59.99 per month (or about $30.00/month when billed annually at $359.94), provides full access to this AI-powered platform. This allows traders to optimize strategies using robust data instead of relying solely on gut instincts. Explore Backtesters and Screeners to complement your research.
Tracking Market Volatility with Oscillator Matrix
Market volatility plays a key role in determining position sizes. LuxAlgo’s Oscillator Matrix offers a comprehensive way to monitor trends and reversals. Its Smart Money Flow component tracks liquidity to reveal current conditions [External].
The Hyper Wave Oscillator identifies trends and divergences, while Confluence Zones highlight areas of market consensus. Pair with Liquidation Estimates (Real-Time) to gauge liquidity-driven volatility.
Position Sizing Mistakes to Avoid and Best Practices
Even with the best tools and strategies, traders often make mistakes that can undermine their position sizing efforts. Recognizing these pitfalls and sticking to disciplined practices is essential for protecting your account and achieving consistent results.
Avoiding Overleveraging and Emotional Trading Decisions
Overleveraging is one of the fastest ways to put your account at risk. When you use excessive leverage, any small market move against your position can lead to outsized losses. Combine this with emotional trading – where fear or greed takes over – and you’ve got a recipe for disaster. For instance, some traders double down on losing trades, hoping to recover their losses, or increase position sizes after a winning streak, assuming they’ve found a “can’t-lose” strategy.
The key to avoiding these traps is strict risk management. Stick to the 1–2% rule: never risk more than 1–2% of your account on a single trade. If you’re trading with a $100,000 account and follow the 2% rule, your maximum risk per trade is $2,000. This approach ensures that even a string of losses won’t significantly drain your account [External].
Emotional control is just as important. Treat each trade as part of a larger strategy, not as an isolated event. Use stop‑loss orders to enforce discipline and protect yourself from impulsive decisions. These predefined exit points help you stick to your plan, even when emotions might push you to act otherwise.
Setting Stop-Losses and Risk Limits
Every trade needs a clear exit plan, and stop-loss orders are your safety net. These orders automatically close your position if the market moves beyond your acceptable loss level. For example, if you buy a stock at $50 and set a stop-loss at $48, your risk per share is $2. With a $1,000 risk limit (1% of a $100,000 account), you could purchase up to 500 shares.
To improve your odds of profitability, aim for a risk-reward ratio of at least 1:2. This means risking $1 to potentially make $2 – a strategy that can help you stay ahead over the long term. You can also use trailing stop indicators to lock in gains as prices move in your favor. Additionally, setting daily loss limits can prevent you from overtrading or making rash decisions after a losing streak.
Reviewing and Updating Your Position Sizing Strategy
A position sizing strategy isn’t static – it should evolve as your account balance and market conditions change. A strategy that works in calm markets might fail during periods of high volatility.
Adjusting your position size based on volatility is critical. During uncertain times, scaling back exposure can help preserve capital. Tools like ATR are useful for measuring volatility and adjusting trades accordingly. Consider monitoring trend tools such as Market Structure Oscillator or Opening Range with Breakouts & Targets for objective signals.
| Volatility Level (ATR) | Suggested Leverage | Position Size Example (1% Risk on $100,000) | Market Conditions |
|---|---|---|---|
| < 1% of price | Up to 10:1 | 500 shares | Low volatility, trending |
| 1–2% of price | 5:1 | 200 shares | Moderate volatility |
| 2–3% of price | 3:1 | 100 shares | High volatility |
| > 3% of price | 1:1 or no leverage | Minimal exposure | Extreme volatility |
Tracking your performance is just as important as adjusting your strategy. Keep a trading journal to monitor your position sizing decisions and outcomes. Over time, analyze metrics like your profit‑to‑loss ratio, capital preservation, and overall strategy performance. For systematic signals and confluence, consult Oscillator Matrix Confluence.
Incorporate your risk tolerance, stop-loss levels, and profit targets into every trade. If you hit your total risk limit, take a step back and reassess the market before initiating new positions. Regular reviews – weekly or monthly – can help you identify patterns and refine your approach based on actual results.
Lastly, true diversification means spreading risk across uncorrelated assets. Be cautious of thinking you’re diversified if all your positions are tied to the same market factors. Diversification is only effective when it genuinely reduces your overall exposure to risk (overview).
Conclusion: Building Consistent Trading Results Through Proper Position Sizing
After diving into the key methods and tools, one thing stands out: position sizing is the cornerstone of effective risk management.
It’s what separates traders who thrive over the long haul from those who face devastating losses. The line between sustained success and account wipeouts often boils down to how you handle risk on every trade.
By managing risk with discipline – such as limiting exposure to 1–2% per trade – a $10,000 account can weather multiple losses without compromising its core capital. In contrast, risking 20% per trade could empty the account after just a few bad moves. This safety‑first approach is what keeps you in the game when inevitable drawdowns occur.
Position sizing also helps remove emotional decision‑making, keeping your strategy grounded in logic. LuxAlgo’s AI Backtesting and toolkit indicators like Oscillator Matrix provide data‑based insights to refine your approach.
The key to long‑term success isn’t about hitting it big on every trade – it’s about consistency. Professional traders who stick to strict position sizing rules tend to outperform those who rely on gut feelings or arbitrary decisions. The goal is to stay in the game long enough for your edge to work across hundreds of trades.
To build a lasting trading strategy, treat position sizing as a dynamic process. Adjust and refine your approach as market conditions shift. When you want to test ideas rapidly, use LuxAlgo’s AI Backtesting updates and documentation.
FAQs
How can I choose the right position sizing method for my trading style and risk tolerance?
Choosing how to size your trading positions boils down to your specific goals, how much risk you're comfortable with, and the current market environment. Two popular approaches traders often use are:
- Percentage‑Based Sizing: Here, you risk a set percentage of your total capital – usually between 1% and 3% – on each trade. This method is straightforward and ensures your risk scales with the size of your account.
- Volatility‑Based Sizing: This approach tailors your position size to the market's volatility. It’s especially useful for managing risk when market conditions are less predictable.
Match your sizing method with objective signals from Signals & Overlays or Signal Modes to keep decisions consistent.
How does market volatility affect position sizing, and how can tools like ATR help manage it?
Market volatility plays a crucial role in determining position sizes because it directly affects the level of risk in trading. When volatility is high, reducing position sizes is often a smart move to keep potential losses in check. During periods of lower volatility, traders might consider slightly larger positions while still keeping risks controlled.
One helpful tool is the Average True Range (ATR), which measures typical price movement. By incorporating ATR into your strategy, you can adjust position sizes to match the market’s behavior, ensuring risk management stays consistent regardless of the market's ups and downs. Learn more about ATR here.
How can I use LuxAlgo tools to optimize my position sizing and manage trading risks effectively?
LuxAlgo provides exclusive TradingView toolkits (PAC, S&O, OSC) plus AI Backtesting at luxalgo.com/backtesting. While there isn’t a dedicated position‑size calculator, you can combine toolkit signals with Backtesters and AI strategy discovery to validate risk per trade and stop placement before going live.
References
LuxAlgo Resources
- LuxAlgo — Home
- Indicator Library
- Managing Trade Risk & Consecutive Losses
- Risk‑Reward Ratio vs. Win Rate
- Risk‑Reward Ratio — Basics
- Market Structure (Intrabar)
- Trend Starter
- Oscillator Matrix
- Liquidation Estimates (Real‑Time)
- Fibonacci Trailing Stop
- Market Structure Trailing Stop
- Opening Range with Breakouts & Targets
- Backtesters
- Screeners
- AI Backtesting Assistant
- AI Backtesting — Complete Breakdown
- AI Backtesting — Millions of Strategies
- AI Backtesting — Docs (Intro)
- AI Backtesting — Docs (Fetching Strategies)
- Price Action Concepts — Docs
- Signals & Overlays — Docs
- Signals & Overlays — Signal Modes
- PAC — Market Structures
- Oscillator Matrix — Confluence


