Bill Ackman: Key Trading Strategy Insights
Bill Ackman’s approach centers on concentrated, long-term investments in businesses whose value Pershing Square believes the market underestimates. It combines fundamental research, selected efforts to influence companies, and occasional hedges. These are investment-management practices, not a ready-made intraday trading system.
The useful lesson is how to structure a thesis and test its weaknesses. Copying a famous investor’s holdings does not reproduce that investor’s entry price, resources, influence, hedges or ability to endure losses. Successful cases belong alongside unsuccessful ones when evaluating the approach.
The Core of Pershing Square’s Approach
Pershing Square Holdings describes its strategy as concentrating the substantial majority of its portfolio in typically eight to twelve core holdings. It emphasizes liquid, listed, large-cap North American businesses with predictable, recurring cash flow and generally adds one to three new core investments per year. Those are descriptions of its approach, not recommended portfolio limits for every reader.
Keep the entities and their histories separate: Pershing Square Capital Management, the investment manager, was founded in January 2004. Pershing Square Holdings began operations in December 2012 and became a closed-ended investment company in 2014. An undated return “since 2004” cannot automatically describe the entire history of that particular vehicle.
| Principle | Research question | Main limitation |
|---|---|---|
| Business quality | How durable are revenue, margins and cash generation? | A strong business can still be an expensive investment |
| Valuation | What assumptions explain the gap between price and estimated value? | Estimated value changes when the assumptions fail |
| Concentration | How much damage could one thesis cause? | Fewer holdings increase company-specific exposure |
| Catalyst or activism | What might change operations, governance or market expectations? | The investor may not control the timing or outcome |
| Hedging | Which defined risk does the instrument offset? | Cost, timing and an imperfect offset can undermine protection |
Historical Portfolio Video
This independent video by Value Investing with Sven Carlin, Ph.D., published March 31, 2018, discusses Ackman’s portfolio and strategy at that time. It is historical commentary, not a current holdings list or a statement from Pershing Square.
Value Investing Begins with the Business
A value thesis needs more than a falling share price. Examine how the company earns money, what protects its competitive position, how much cash its operations produce, and which obligations come before shareholders. Separate a temporary operating problem from a lasting deterioration in the business.
Build several valuation scenarios rather than treating one estimate as precise. For a hypothetical company, compare a base case with slower revenue growth, weaker margins, greater reinvestment needs and a less favorable valuation multiple. A discount to an optimistic estimate is not necessarily a margin of safety.
- Read the company’s financial statements and the notes explaining debt, cash flow and significant risks.
- Identify which assumptions matter most to the valuation and what evidence would contradict them.
- Distinguish a company’s operating improvement from a change in its share-price multiple.
- Write a dated thesis before committing capital and update it when new evidence changes the case.
Activism: A Potential Catalyst, Not a Guaranteed Turnaround
Pershing Square says that, in certain cases, it seeks to catalyze changes in management, operations or governance. This does not mean every holding is an activist campaign or that a large minority shareholder controls the business. Other shareholders, directors, management and market conditions affect the outcome.
Chipotle provides a documented governance example. In its December 16, 2016 announcement, the company named four new directors, effective December 14. It also described agreements with Pershing Square connected with those appointments. The appointees included Pershing Square partner Ali Namvar and advisory-board member Matthew Paull.
That announcement supports the board-refresh case. It does not, by itself, prove that Ackman caused every subsequent operating improvement or share-price gain. A useful analysis separates the action taken, changes in business results, and the investment’s return over a clearly stated period.
The same standard applies when studying familiar activist or distressed-investment examples such as Canadian Pacific or General Growth Properties: check the original filings, dates, capital structure and corporate actions before using a price comparison. A famous case name is not enough to establish a repeatable trading rule.
Concentration Makes Mistakes Matter More
An eight-to-twelve-holding portfolio can express strong conviction, but it can also leave substantial exposure to a few businesses, sectors or shared economic risks. Counting company names alone does not measure diversification. Several holdings can respond similarly to interest rates, consumer demand or financing conditions.
Consider a hypothetical unleveraged portfolio with 20% in one stock. If that stock falls 40% while everything else is unchanged, the direct portfolio loss is 8%. This simplified calculation ignores fees, taxes, currency movements and any offsetting hedge. It illustrates why a compelling thesis still needs position sizing.
Do not assume Pershing Square uses a universal five-to-six-percent loss cap for every investment. Position size, price gaps, liquidity, financing and the instrument itself determine possible losses. A planned exit price is not a guaranteed execution price.
Include Losing Periods in the Record
The opening table of PSH’s 2017 annual-report letter reports a −4.0% net return for the year ended December 31, 2017, versus a reported S&P 500 comparison of +21.8%. Its gross return was −2.6%. Those dated figures are more informative than an undated claim of consistent outperformance.
The report’s gross performance attribution lists Herbalife at −4.0% and Chipotle at −2.7%. These are contributions to portfolio performance, not those stocks’ price returns or a calculation of the lifetime result of each investment. They also show why a discussion of research and conviction must acknowledge setbacks.
Herbalife should not be presented only as a successful example of adapting a position. A change in instrument or tactics does not establish that a thesis made money. Likewise, a negative year does not by itself explain every later outcome. Match the period, vehicle and return definition before drawing a conclusion.
When comparing results, specify whether the figure is gross or net, the exact dates and the benchmark convention. Do not mix a fund’s annual return, a security’s price move and a hedge’s proceeds. A since-inception annualized comparison also needs a common period and a clearly identified vehicle.
The 2020 Hedge: Proceeds Are Not Fund Returns
In a March 25, 2020 investor letter, Pershing Square described credit protection on global investment-grade and high-yield indices. It said the hedge was exited on March 23 and generated $2.6 billion of proceeds across the Pershing Square funds, including $2.1 billion for PSH, against $27 million of premiums and commissions.
| Reported item | Amount or description | How to interpret it |
|---|---|---|
| Premiums and commissions | $27 million | The stated cost, not the total value of the funds |
| Exit proceeds across the funds | $2.6 billion | Proceeds, not an independently calculated net-profit figure |
| Proceeds attributable to PSH | $2.1 billion | A subset of the total, not an additional $2.1 billion |
| Instrument | Credit protection on specified indices | Different from simply shorting stocks or selling bonds |
| Portfolio context | Offsetting equity losses and reinvesting proceeds | One hedge payoff does not equal the whole portfolio return |
The letter explains that the gains offset equity mark-to-market losses and that proceeds were redeployed into investments. The headline payoff therefore cannot be called a roughly hundredfold return on the entire fund or substituted for a full-year result. Even a simple proceeds-to-premium comparison omits important portfolio context.
The transferable question is whether a hedge addresses a defined exposure at an acceptable cost. Assess what would make it pay, what would make it expire or lose value, how liquid it is, and whether its behavior matches the assets being protected. A striking historical payoff does not mean the same trade is currently available.
Interest-rate, credit and equity hedges are not interchangeable. Avoid treating a rates-derivative position as an ordinary short-bond trade or combining profits reported over different dates. Instrument terms and timing are essential to evaluating an asymmetric payoff.
Apply the Research Process in LuxAlgo
Use LuxAlgo’s native charts to organize price research alongside your fundamental thesis. Compare the relevant symbols and timeframes, record event dates and distinguish an observable chart condition from a claim about the business. This is a workflow for your own analysis; it does not imply Ackman or Pershing Square uses LuxAlgo.
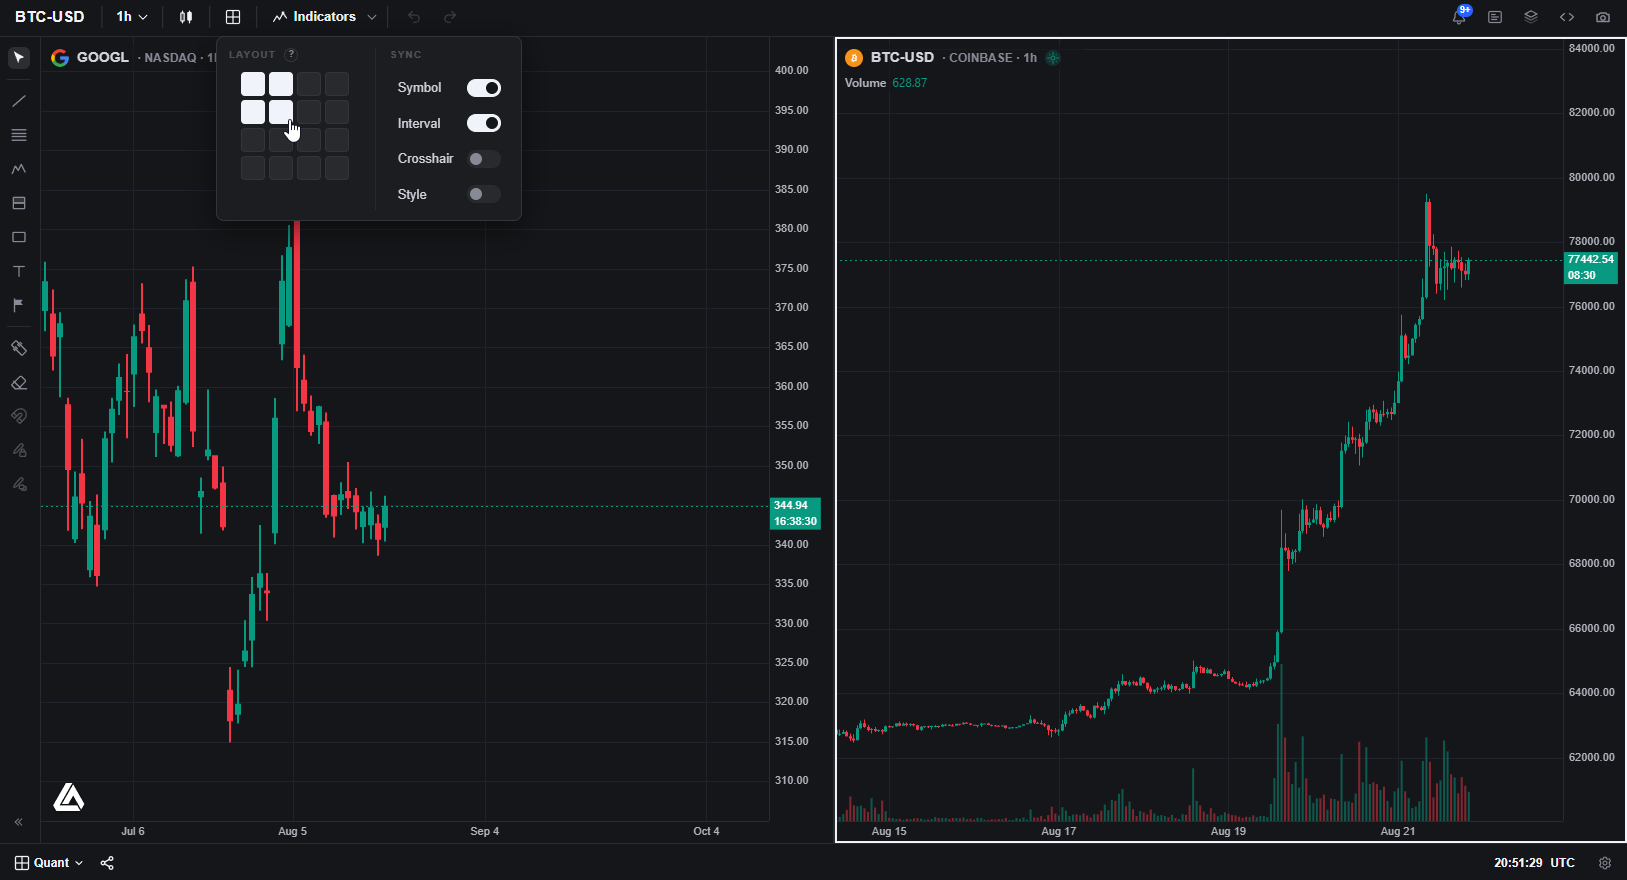
Check native market-data coverage before interpreting volume or comparing markets. The documented US-equity source is Cboe EDGX, rather than a consolidated all-venue feed. Candle history does not provide a company’s financial statements, a complete hedge book or another investor’s intentions.
For a defined chart question, ask Quant, our coding agent to help express a supported strategy—for example, a price condition you want to compare across a dated sample. Inspect the generated code and run it manually. Then review the strategy settings, costs and individual trades and test a later period rather than selecting only the best historical result.
A candle-based backtest cannot reproduce the full economics of an activist campaign or the 2020 credit hedge. Keep the test’s narrower purpose explicit. LuxAlgo’s TradingView toolkits are a separate workflow from native charts; the legacy Backtesting Assistant is not the current native chart-strategy workflow.
The workspace video below demonstrates organizing related chart research. Keep a dated thesis, source links and the limitations of each test with your records so later reviews reflect what you actually knew at the time.
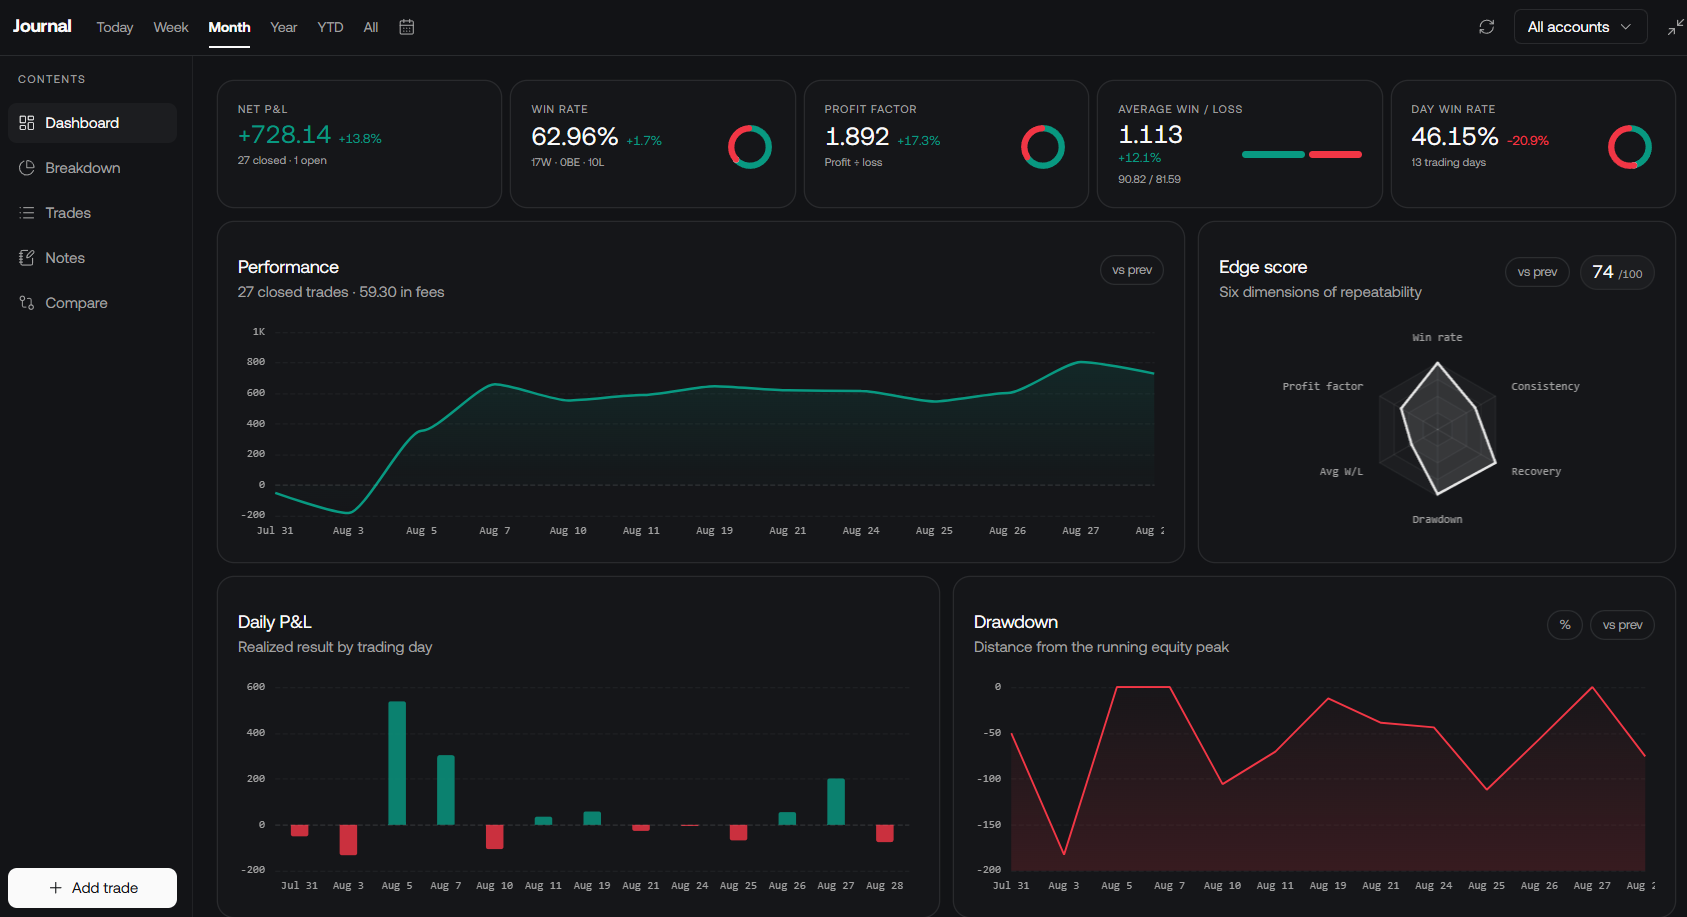
The native journal supports reviewing imported trade records. Use those records alongside your thesis notes to distinguish decision quality from a favorable outcome. A journal is not a substitute for broker statements or a complete valuation model.
A Practical Research Checklist
- Define the business thesis and the evidence that would invalidate it.
- Estimate value under several assumptions and separate operating performance from market pricing.
- Size the position against a realistic loss scenario and the risks already in the portfolio.
- Identify any catalyst and what remains outside your control.
- Evaluate a hedge by its terms, cost and exposure match, not by a famous historical payoff.
- Review both successful and unsuccessful cases using dated, comparable results.
- Record decisions before the outcome is known, then reassess when the evidence changes.
Ackman’s approach is useful as a study in concentrated research and active ownership. Its application requires independent judgment, resources and risk capacity. The goal is a clearer, falsifiable investment process, not confidence borrowed from a well-known name.
Frequently Asked Questions
Is Bill Ackman’s approach an intraday trading strategy?
It is primarily a concentrated, long-term investment approach based on business research, valuation, selected activism and occasional hedging. It is not a ready-made intraday entry-and-exit system.
How many core holdings does Pershing Square describe?
Pershing Square Holdings describes typically eight to twelve core holdings representing the substantial majority of its portfolio. That description is not a recommended allocation for every investor.
Was the 2020 hedge a $2.6 billion return for PSH alone?
No. The March 2020 letter reported $2.6 billion of proceeds across the Pershing Square funds, including $2.1 billion for PSH. Hedge proceeds are different from the return of an entire fund.
Does the Chipotle board change prove Ackman caused its returns?
No. The company’s December 2016 announcement documents board appointments and agreements with Pershing Square. Establishing what caused subsequent business results or investment returns requires additional evidence.
Can LuxAlgo reproduce an activist investment strategy from candles?
No. Native charts and Quant can support defined chart research, but candles do not reproduce company valuation, governance influence or complex credit hedges. Inspect generated code and run supported tests manually.
Read next