


3D MACD Bar Plot
 by LuxAlgo · Feb 12, 2026
The 3D MACD Bar Plot indicator is an advanced trading indicator that transforms the traditional MACD into a powerful multi-parameter momentum surface. Instead of relying on a single Fast and Slow EMA combination, this tool visualizes dozens of MACD configurations simultaneously in a dynamic 3D grid. The result is a deeper understanding of momentum clusters, trend robustness, and parameter stability — helping traders build more reliable trading strategies across timeframes.
How to Use the 3D MACD Bar Plot Trading Indicator?
Most traders are familiar with the classic MACD setup (12, 26, 9). However, one of the biggest weaknesses of any technical indicator is parameter sensitivity — small changes in inputs can produce very different signals.
The 3D MACD Bar Plot solves this by displaying an entire surface of MACD values across multiple Fast and Slow EMA combinations at the same time. Rather than asking:
“Is the MACD bullish with this one setting?”
You can now ask:
“Is momentum bullish across most reasonable EMA combinations?”
This shift turns the MACD from a single-line oscillator into a full momentum landscape.
Identifying Momentum Clusters for Strong Trading Signals
A key concept behind this trading indicator is momentum clustering.
When most of the 3D bars are:
- Tall
- Consistently bullish in color
- Aligned in the same direction
This indicates that many EMA combinations agree on trend direction. That agreement forms a momentum cluster, suggesting a strong and broadly supported trend.
In contrast:
- Mixed bullish and bearish bars
- Small or uneven bar heights
- A fragmented surface
These conditions suggest indecision, ranging markets, or early transitions. This is especially useful for traders who want to avoid entering during choppy environments.
For systematic traders, this visualization can act as a confirmation layer to filter false breakouts and weak signals.
Measuring Trend Robustness Across EMA Combinations
One of the most powerful applications of this trading strategy tool is evaluating trend robustness.
A robust trend appears when:
- The entire 3D surface slopes steeply in one direction
- Most parameter combinations produce similar MACD values
- There is minimal disagreement across the grid
This suggests the trend is not dependent on a single EMA setting — it is structurally strong.
However, if only a small region of the grid (for example, very fast EMAs) shows strength while the rest remains flat or conflicting, the trend may be fragile or highly sensitive to short-term volatility.
For professional traders and quants, this offers an intuitive way to evaluate indicator stability before deploying a strategy.
Understanding the 3D Projection Framework
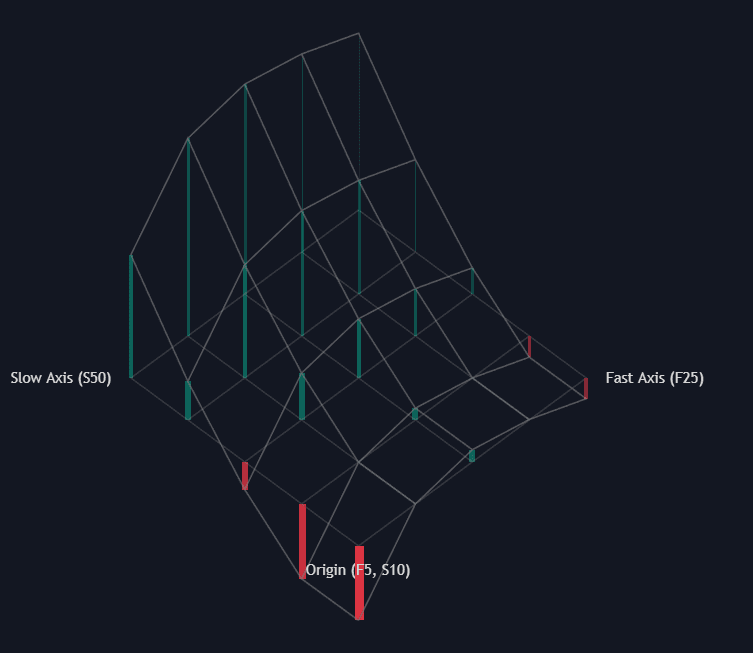
The script uses a pseudo-3D isometric projection to map the MACD matrix onto your chart.
- The Fast Axis (X) represents variations in the Fast EMA length.
- The Slow Axis (Y) represents variations in the Slow EMA length.
- The Height (Z-axis) represents the resulting MACD value (Fast EMA − Slow EMA).
This projection creates a surface-like structure that visually communicates both direction and magnitude of momentum.
Because depth can clutter charts, the indicator dynamically adjusts transparency. Bars further back in the 3D space become more transparent, helping you focus on the global structure of the surface instead of individual values.
How the 3D MACD Surface Is Calculated
Under the hood, the indicator computes a full matrix of MACD values by iterating through the Fast and Slow EMA ranges defined in the settings.
Instead of plotting individual histograms separately, the script:
- Iterates through all EMA combinations based on user-defined step increments.
- Calculates Fast EMA − Slow EMA for each combination.
- Maps those values into a 2D coordinate space using a snaking polyline algorithm.
- Applies dynamic depth transparency for visual clarity.
This architecture ensures performance efficiency while maintaining a clean 3D appearance.
SETTINGS
The indicator is highly customizable, allowing traders to explore different MACD structures and optimize their trading strategies.
Grid Configuration
- Fast Min/Max/Step: Defines the range and increments for the Fast EMA lengths used in the calculation.
- Slow Min/Max/Step: Defines the range and increments for the Slow EMA lengths used in the calculation.
By expanding the range, traders can analyze short-term scalping sensitivity or long-term swing structures.
3D Projection Settings
- Y Baseline Price: Adjusts the vertical anchor point of the 3D plot.
- X Spacing (bars): Controls the horizontal spread between the 3D grid points.
- Z Height: Scales the height of the MACD bars relative to the grid spacing.
These controls help balance visual clarity with analytical depth.
Style Customization
- Bullish/Bearish Color: Sets the colors for positive and negative MACD bars.
- Grid Color: Controls the color of the connecting surface lines and base grid.
Traders can align the appearance with their existing chart themes while preserving readability.
Why This Trading Indicator Improves MACD-Based Strategies
The 3D MACD Bar Plot enhances traditional MACD-based trading strategies by:
- Reducing parameter sensitivity risk
- Revealing consensus across EMA structures
- Highlighting fragile vs. structurally strong trends
- Providing visual confirmation for discretionary and systematic traders
Whether used for momentum trading, trend-following systems, or as a confirmation tool within a broader trading strategy, this indicator offers a structural edge over single-setting oscillators.
FAQ
What makes the 3D MACD Bar Plot different from a normal MACD indicator?
A traditional MACD uses one Fast and Slow EMA combination. The 3D MACD Bar Plot calculates many combinations simultaneously and visualizes them as a 3D momentum surface, allowing traders to assess parameter stability and trend robustness.
Is this trading indicator suitable for all markets?
Yes. The 3D MACD Bar Plot can be applied to stocks, crypto, forex, indices, and commodities. It adapts to any timeframe, making it useful for scalpers, swing traders, and long-term investors.
How do momentum clusters improve trading decisions?
Momentum clusters show when multiple EMA combinations agree on direction. This consensus increases confidence that a trend is strong and not dependent on a single parameter choice.
How can I access the 3D MACD Bar Plot indicator?
You can get access on the LuxAlgo Library for charting platforms like TradingView, MetaTrader (MT4/MT5), and NinjaTrader for free.
Unlock Unlimited Access to the LuxAlgo Library
Upgrade your plan to get all indicators, strategies, charts, and full access to Quant, our AI agent.
Trading & investing are risky and many will lose money in connection with trading and investing activities. All content on this site is not intended to, and should not be, construed as financial advice. Decisions to buy, sell, hold or trade in securities, commodities and other investments involve risk and are best made based on the advice of qualified financial professionals. Past performance does not guarantee future results.
Hypothetical or Simulated performance results have certain limitations. Unlike an actual performance record, simulated results do not represent actual trading. Also, since the trades have not been executed, the results may have under-or-over compensated for the impact, if any, of certain market factors, including, but not limited to, lack of liquidity. Simulated trading programs in general are designed with the benefit of hindsight, and are based on historical information. No representation is being made that any account will or is likely to achieve profit or losses similar to those shown.
Testimonials appearing on this website may not be representative of other clients or customers and is not a guarantee of future performance or success.
As a provider of technical analysis tools and strategies, we do not have access to the personal trading accounts or brokerage statements of our customers. As a result, we have no reason to believe our customers perform better or worse than traders as a whole based on any content, tool, or platform feature we provide.
Charts used on this site are by TradingView in which the majority of our technical indicators are built on. TradingView® is a registered trademark of TradingView, Inc. www.TradingView.com TradingView® has no affiliation with the owner, developer, or provider of the Services described herein.
Market data is provided by CBOE, CME Group, BarChart, Massive, CoinAPI. Select U.S. equities data is provided through Massive. CBOE BZX real-time U.S. equities data is licensed from CBOE and provided through BarChart. Real-time futures data is licensed from CME Group and provided through BarChart. Select cryptocurrency data, including major coins, is provided through CoinAPI. All data is provided “as is” and should be verified independently for trading purposes.
This does not represent our full Disclaimer. Please read our full disclaimer.
© 2026 LuxAlgo Global, LLC.