A Beginner’s Guide to Technical Indicators
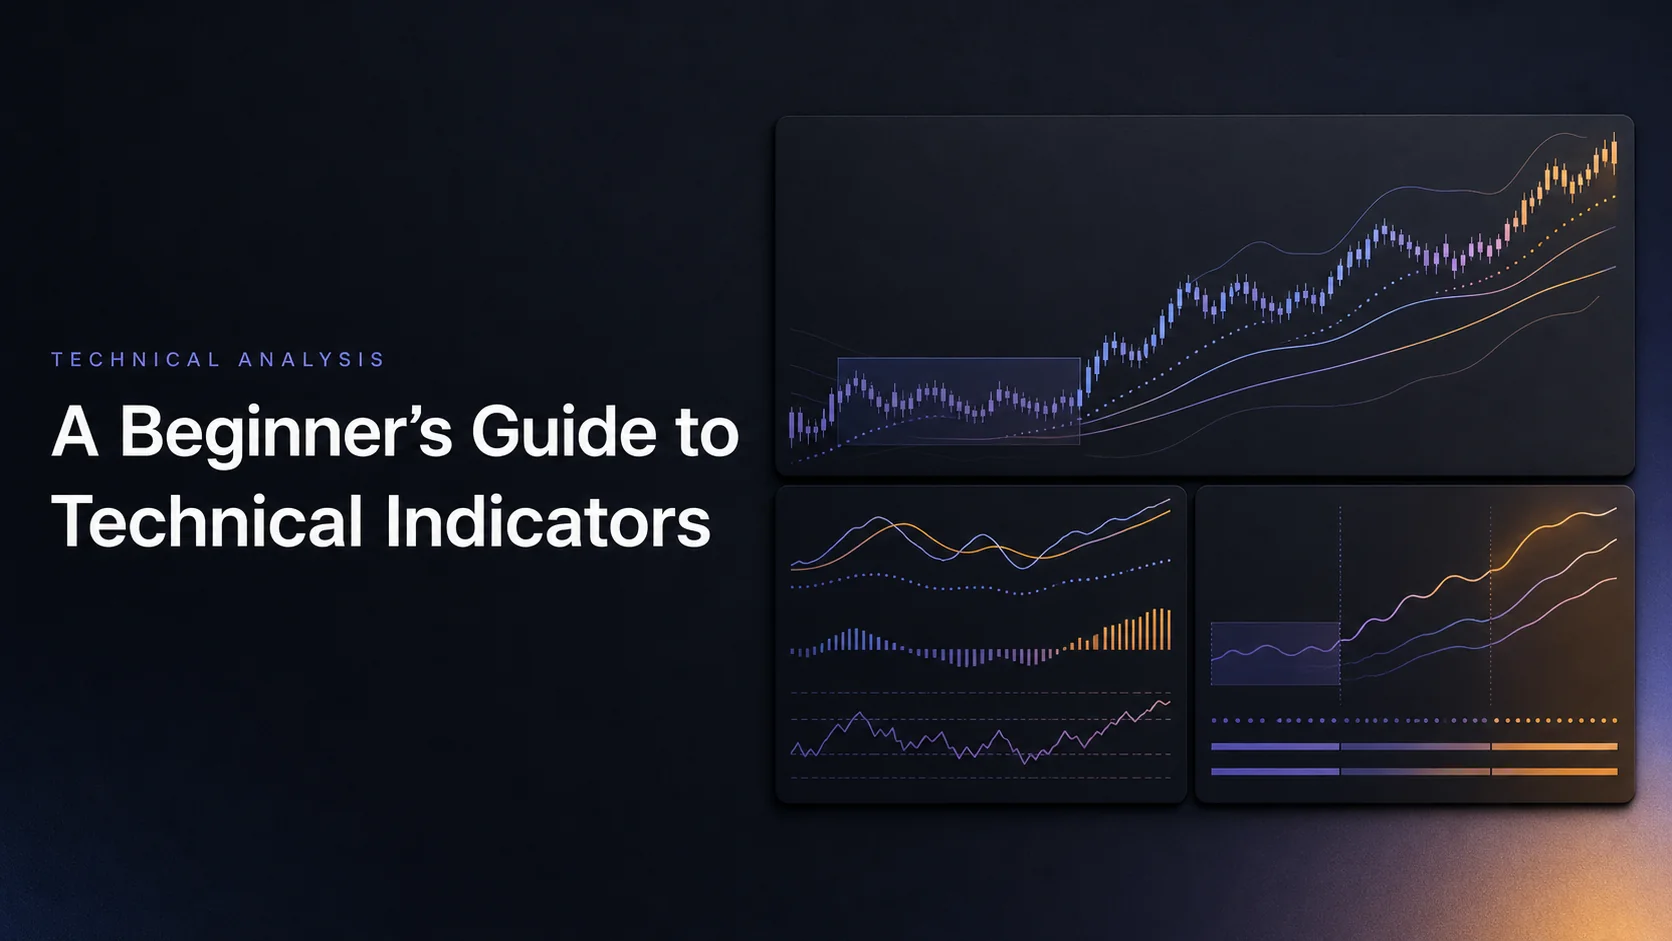
Technical indicators turn price, volume, and other market data into measurements you can compare over time. Moving averages summarize direction, RSI describes momentum, and MACD compares two exponential averages. They help organize a trading question; they do not independently tell you what will happen next.
A useful beginner workflow is to learn one calculation, observe it on a chart, and test a complete set of rules before risking money. In LuxAlgo, start with the native chart’s Basic indicators, then use Quant to help code a specific strategy when you can explain its entry, exit, and sizing rules.
- Trend: moving averages smooth price and help describe direction.
- Momentum: RSI and MACD describe changes in price behavior.
- Volume: OBV and VWAP use recorded trading activity alongside price.
- Volatility: Bollinger Bands and ATR describe dispersion or range, not a guaranteed direction.
Four Main Types of Technical Indicators
The categories overlap. MACD is both trend-following and momentum-related, while Bollinger Bands combine an average with a volatility measure. Choose a tool for the question it answers, rather than adding one from every category simply to fill the chart.
| Category | Examples | What to watch for |
|---|---|---|
| Trend | SMA, EMA, moving-average crossovers | Smoothing introduces lag; sideways markets can produce repeated crossings. |
| Momentum | RSI, MACD | Strong or weak readings can persist; a change in momentum is not necessarily a price reversal. |
| Volume | OBV, VWAP, Volume Profile | Interpret readings within the feed’s venue and data coverage; activity does not identify institutions. |
| Volatility | Bollinger Bands, ATR | Expansion and contraction describe changing conditions without deciding the next move. |
Trend Indicators
A rising average means its calculation is increasing; price above that average provides additional context. A 50-day SMA crossing above a 200-day SMA is commonly called a golden cross, with the opposite crossing called a death cross. Both depend on past prices. Their value must be assessed across many trades and market conditions rather than inferred from a single stock’s subsequent rally.
Momentum Indicators
Momentum measures how price is changing. An oscillator can weaken while price still rises, or strengthen while price still falls. Such disagreement can motivate a closer look, but it is not an instruction to immediately trade against the current move. Several momentum tools may largely repeat the same information.
Volume Indicators
OBV adds the bar’s volume when its close is higher than the previous close, subtracts it when lower, and leaves the total unchanged for an equal close. It classifies the whole bar using that price change; it does not directly measure every buyer-initiated or seller-initiated trade. Divergence between OBV and price is a hypothesis to evaluate, not proof of hidden accumulation.
VWAP is a volume-weighted average over a defined period or anchor window. It describes where recorded trading occurred on average. A price crossing VWAP cannot establish that institutional traders support the move. Verify whether the chart uses exchange volume, venue-specific activity, or a forex feed’s tick volume before comparing readings across markets.
Volatility Indicators
Traditional Bollinger Bands use a moving average with upper and lower bands based on standard deviation. The familiar 20-period average and two-standard-deviation setting is a default, not a promise that 95% of future prices will stay inside. John Bollinger’s rules explain that a band touch alone is not a buy or sell signal and that prices can continue along an outer band during a trend.
Three Basic Indicators for New Traders

Moving Averages: SMA and EMA
A simple moving average gives equal weight to the observations in its window. If the last five closes are 10, 11, 12, 13, and 14, the five-period SMA is 12. When a new close of 15 arrives, the oldest close drops out and the average becomes 13. On an hourly chart those are hourly observations; on a daily chart they are daily observations.
A conventional EMA updates as new EMA = previous EMA + alpha × (new price − previous EMA), where alpha = 2 ÷ (length + 1). For length 20, alpha is approximately 9.52%. If the previous EMA is 100 and the new close is 102, the updated EMA is approximately 100.1905. Initialization and the amount of available history can affect early values.
For the same length, an EMA generally responds sooner to new prices than an SMA, but that can also mean more movement around noisy price changes. Common examples include 5-, 10-, or 20-period averages for shorter horizons and 50-, 100-, or 200-period averages for broader context. None is confined to one trading style or universally optimal.
RSI: Strength of Gains Relative to Losses
The Relative Strength Index (RSI) maps smoothed gains relative to smoothed losses onto a 0–100 scale. Wilder’s conventional calculation uses 14 periods with smoothing weight 1/14 after initialization. With RS = average gain ÷ average loss, RSI = 100 − 100 ÷ (1 + RS). If average gain is twice average loss, RSI is about 66.67.
Above 70 is conventionally described as overbought and below 30 as oversold. These are threshold labels, not measured probabilities of a reversal. RSI can remain elevated in an uptrend or depressed in a downtrend. A move back across 30 or 70 is a different event from merely being beyond it.
Shorter settings, such as 9 or 11, tend to react more quickly; longer settings, such as 21 or 25, generally smooth more. Test that tradeoff rather than assigning a length solely from a trader label. A regular bullish divergence compares a lower price low with a higher RSI low; bearish divergence compares a higher price high with a lower RSI high. If identifying a pivot needs later bars, the signal is available only after those bars arrive.
MACD: Two Averages and Their Difference
The conventional Moving Average Convergence Divergence (MACD) uses three components:
- MACD: 12-period EMA minus 26-period EMA.
- Signal: a 9-period EMA of MACD.
- Histogram: MACD minus its signal.
If the two price EMAs are 105 and 103, MACD is 2. With a signal value of 1.5, the histogram is 0.5. MACD above zero means the faster EMA exceeds the slower EMA; MACD above its signal is a separate relationship. A histogram shrinking while still positive means that positive gap is narrowing, not necessarily that price is already falling.
MACD is not bounded like RSI, and its raw value depends on the price scale. A 5–35–5 setting changes the fast, slow, and signal periods; it does not shorten all three relative to 12–26–9 because 35 is longer than 26. Alternative settings are experiments, not standard requirements for day traders.
Indicator Combinations to Test
Combining indicators can make a rule more selective, but fewer signals do not automatically mean fewer losing trades or better net results. MACD and RSI both derive from price, so agreement is not independent confirmation. Compare each added condition with a simpler baseline on the same data.
| Combination | Illustrative condition | Question for the test |
|---|---|---|
| MACD + RSI | MACD crosses above its signal on a completed bar while RSI is below 30 and rising. | Does the extra RSI restriction improve outcomes, or merely remove many trades? |
| Moving average + volume | Price closes above a chosen average while volume exceeds a defined historical baseline. | Is the volume comparison appropriate for the session and feed? |
| RSI + Bollinger Bands | Price returns inside the lower band and RSI crosses back above 30. | Does this rebound rule fail during persistent downward trends? |
MACD + RSI
For the table’s illustrative long condition, rising RSI means its current completed value exceeds its previous completed value. A bearish counterpart could require MACD to cross below its signal while RSI is above 70 and falling. Decide whether events must occur on the same bar or within a stated window; these are different rules. A bearish condition could exit a long or initiate a short, and the strategy must specify which.
A crossover should compare both the previous and current completed values, not simply check that MACD is above its signal. None of these conditions specifies position size, holding period, or an exit by itself. Avoid presenting a signal’s frequency as a win rate.
Moving Averages + Volume
Choose a clear volume comparison, such as the signal bar’s volume exceeding the average of the preceding 20 completed bars. For intraday work, consider time-of-day effects: a session open and a quiet midday bar may not be comparable. OBV direction can be another candidate filter, but define its lookback instead of judging “rising” differently on each chart.
RSI + Bollinger Bands
The rebound idea is a mean-reversion hypothesis. Specify whether price must first close below the lower band and then close back inside, or whether an intrabar touch is enough. Likewise, RSI crossing from at or below 30 to above 30 differs from RSI merely moving upward below 30. Price can keep falling despite either event; a band or oscillator does not replace an exit rule.
Set Up Indicators in Native LuxAlgo Charts
Open Quant Charts, LuxAlgo’s native charting platform and select the symbol, timeframe, and chart cell you want to study. Start with standard candles, check the data source and session, and leave enough history for the chosen indicators to initialize.
The Indicators picker has Basic studies including RSI, MACD, Bollinger Bands, and moving averages, plus Orderflow tools and the LuxAlgo Library. Indicators apply to the active chart cell. Add one or two studies that answer a specific question, open their settings from the legend gear or Object tree, and use the Data window to inspect exact values under the crosshair.
Star frequently used studies and save an indicator template once the setup is clear. Templates retain the indicators and their settings. Loading a template replaces the indicators on the selected chart or chosen charts; it does not simply add another set on top. Optional symbol and timeframe settings determine whether those also change.
Explore Library Variants After Learning the Baseline
The Library includes alternatives such as Adaptive MACD, Rainbow Adaptive RSI, RSI Multi Length, and ASFX A2 VWAP. Read the selected implementation’s definition before treating it as the standard formula. A change in smoothing, anchoring, or the number of lengths changes the measurement and can change its signals.
In particular, RSI Multi Length compares multiple RSI lookback lengths; multiple lengths are not automatically multiple chart timeframes. Keep a standard study available for comparison and test a variant’s specific rules instead of assuming “adaptive” means more accurate.
Keep Alerts and Execution Separate
For strategy alerts, verify the supported conditions and notification setup. An indicator appearing on a chart does not automatically create an alert or execute a trade.
Turn a Measurement into a Testable Strategy
Use Quant, our coding agent to help translate a written rule into a strategy. AI can assist with code and revisions; its output does not establish a trading edge or guarantee an improvement in returns. A deterministic adaptive indicator is also not necessarily an AI agent.
For a simple research baseline, specify one market and timeframe, a long entry at the next bar’s open after a completed MACD bullish crossover, and an exit at the next open after a completed bearish crossover. Specify no pyramiding and a fixed allocation. Then compare a second version adding the RSI filter. This is an illustrative comparison with no protective stop in its definition, not a live-trading recommendation; allocation is not a maximum-loss guarantee.
Inspect the generated code for the exact cross conditions, bar timing, sizing, and exits, then run manually in the native strategy workflow. Review individual trades, include fees and slippage, and reserve a later period that did not guide your settings. If the rules change, run the test again.
Judge a strategy by the size of wins and losses as well as their frequency. For example, 60 trades winning $10 and 40 losing $20 produce a $200 loss before costs, despite a 60% win rate. Total costs of $1 per trade would increase that loss to $300 across 100 trades. Check net expectancy, drawdown, exposure, and the number of observations, not a standalone accuracy claim.
Common Beginner Mistakes
- Trading every extreme: RSI and band readings can persist during a strong trend. Write the required price or indicator event explicitly.
- Adding redundant studies: several price-derived indicators may repeat the same information. Test each filter’s contribution.
- Using unfinished values: live-bar signals may disappear, and a higher-timeframe candle is not final until it closes.
- Choosing settings after the result: many trials can produce a convincing historical winner by chance. Keep a later evaluation period untouched.
- Ignoring execution: fees, spread, slippage, gaps, and order assumptions can change results materially.
- Confusing a chart with a record: journal the rule, settings, planned action, actual outcome, and mistakes so comparisons remain consistent.
Practice on historical data and in a suitable demo environment before committing capital. Keep the first setup simple enough to explain without its chart. Change one rule at a time and record why; there is no supported universal percentage by which journaling or adding AI improves trading performance.
RSI Tutorial: Avoiding Common Signal Mistakes
This retained LuxAlgo video is RSI Indicator Trading Strategy (Advanced), rather than a general moving-average and MACD tutorial. Its historical chart examples provide additional RSI context; they are not a current native-platform walkthrough or evidence that a strategy will be profitable.
Frequently Asked Questions
Which technical indicators should a beginner learn first?
Start with a moving average for smoothing price, RSI for momentum, and the components of MACD. Learn what each calculates before combining them, and keep any first test simple enough to explain.
How do you use MACD and RSI together?
Define an exact MACD crossing and an RSI condition on completed bars, including whether they must occur together. Add entry timing, exits, sizing, and costs, then compare the combination with MACD alone on the same data.
Does RSI below 30 mean a price will rebound?
No. Below 30 is conventionally called oversold, but RSI can remain low during a downtrend. A threshold reading is not a reversal probability or a complete trade instruction.
Are indicators with faster settings more accurate?
Faster settings usually respond sooner and can also react more to noise. Accuracy depends on the complete rules, market conditions, and evaluation method, not response speed alone.
Can I use technical indicators directly in LuxAlgo?
Yes. Native LuxAlgo charts include Basic indicators and the LuxAlgo Library. Quant can help code custom studies and strategies; inspect generated strategy code and run manually before interpreting its backtest.
Read next