Top Chart Patterns: Recognize Market Signals
Chart patterns organize price behavior into recognizable structures, but a familiar shape is not a guaranteed market signal. Separate a developing candidate from a completed break, define the entry and exit in advance, and measure the result after costs. Head and shoulders, double tops and bottoms, triangles and candlestick patterns each need their own rules.
Start with native LuxAlgo charts to inspect the price structure. Use Quant, our coding agent, to help translate a clearly defined pattern into a supported indicator or strategy, then inspect the code and run it manually. The Library’s pattern and market-structure tools add automatic annotations on a Quant Chart; their labels still require attention to confirmation timing.
Major chart patterns at a glance
| Pattern | Structure to recognize | Completion or decision point |
|---|---|---|
| Head and shoulders | Three peaks after an advance; the middle peak is highest. | A break of the neckline drawn through the intervening reaction lows. |
| Double top / double bottom | Two separated tests of an approximate high / low region. | A break of the intervening trough / peak; the second test alone is a candidate. |
| Rounding bottom | A gradual decline, base and recovery. | A break of the relevant resistance above the base. |
| Triangle | Converging boundaries: ascending, descending or symmetrical. | A break beyond a defined boundary; either direction remains possible. |
| Flag / pennant | A short consolidation after a sharp move; parallel / converging boundaries. | A break from consolidation; continuation is a hypothesis. |
| Rectangle | Repeated reactions between broadly horizontal support and resistance. | A boundary break, or a separately defined range-trading setup. |
Reversal patterns: define the structure first
Head and shoulders
A head-and-shoulders top develops after an advance: a left shoulder, a higher head and a lower right shoulder. The shoulders need not match exactly. Draw the neckline through the reaction lows between those peaks; it can slope. Before a qualifying neckline break, the structure remains a potential top. An inverse head and shoulders reverses the geometry after a decline.
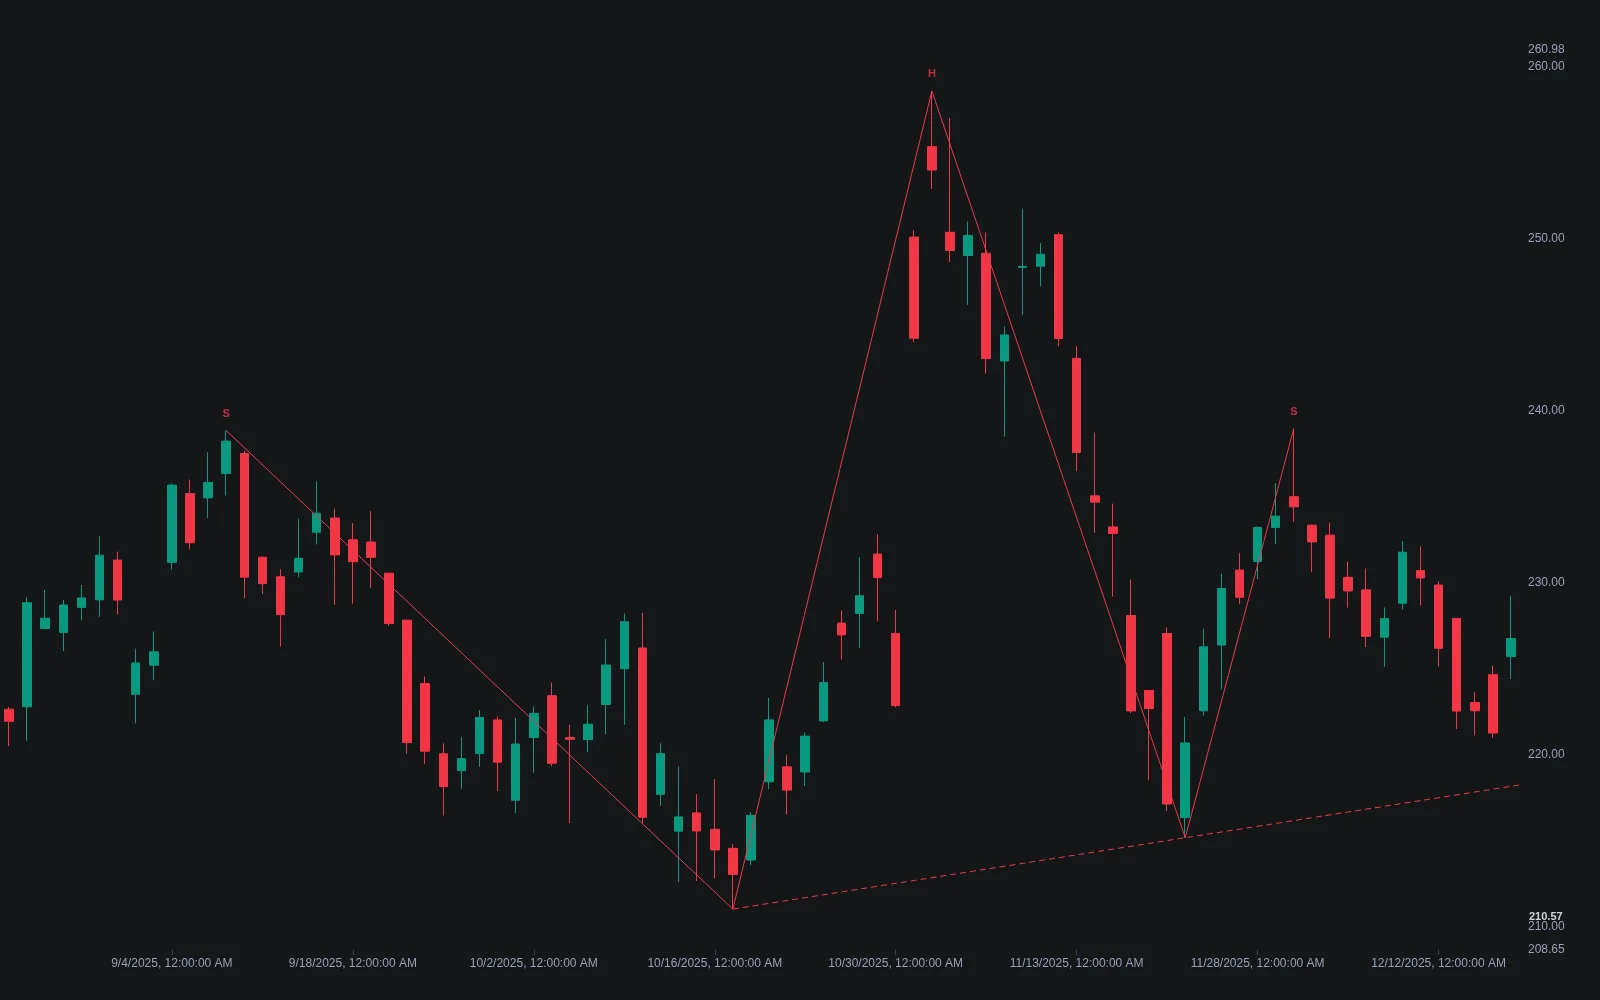
Volume may diminish as the top develops and expand on a break, but textbook volume progression does not occur in every valid-looking formation. A return to the neckline may follow the break; it is not mandatory. The head-to-neckline distance can provide a measured-move reference, but price can reverse before reaching it. Avoid treating a target line as evidence of predictive accuracy.
Double tops and double bottoms
A double top forms two separated peaks near a common price area with a meaningful reaction between them. Its bearish completion convention is a break below that intervening low. A double bottom forms two troughs and uses the intervening high as the bullish breakout reference. Define how similar the extremes must be, their minimum separation and whether a wick or completed close qualifies.
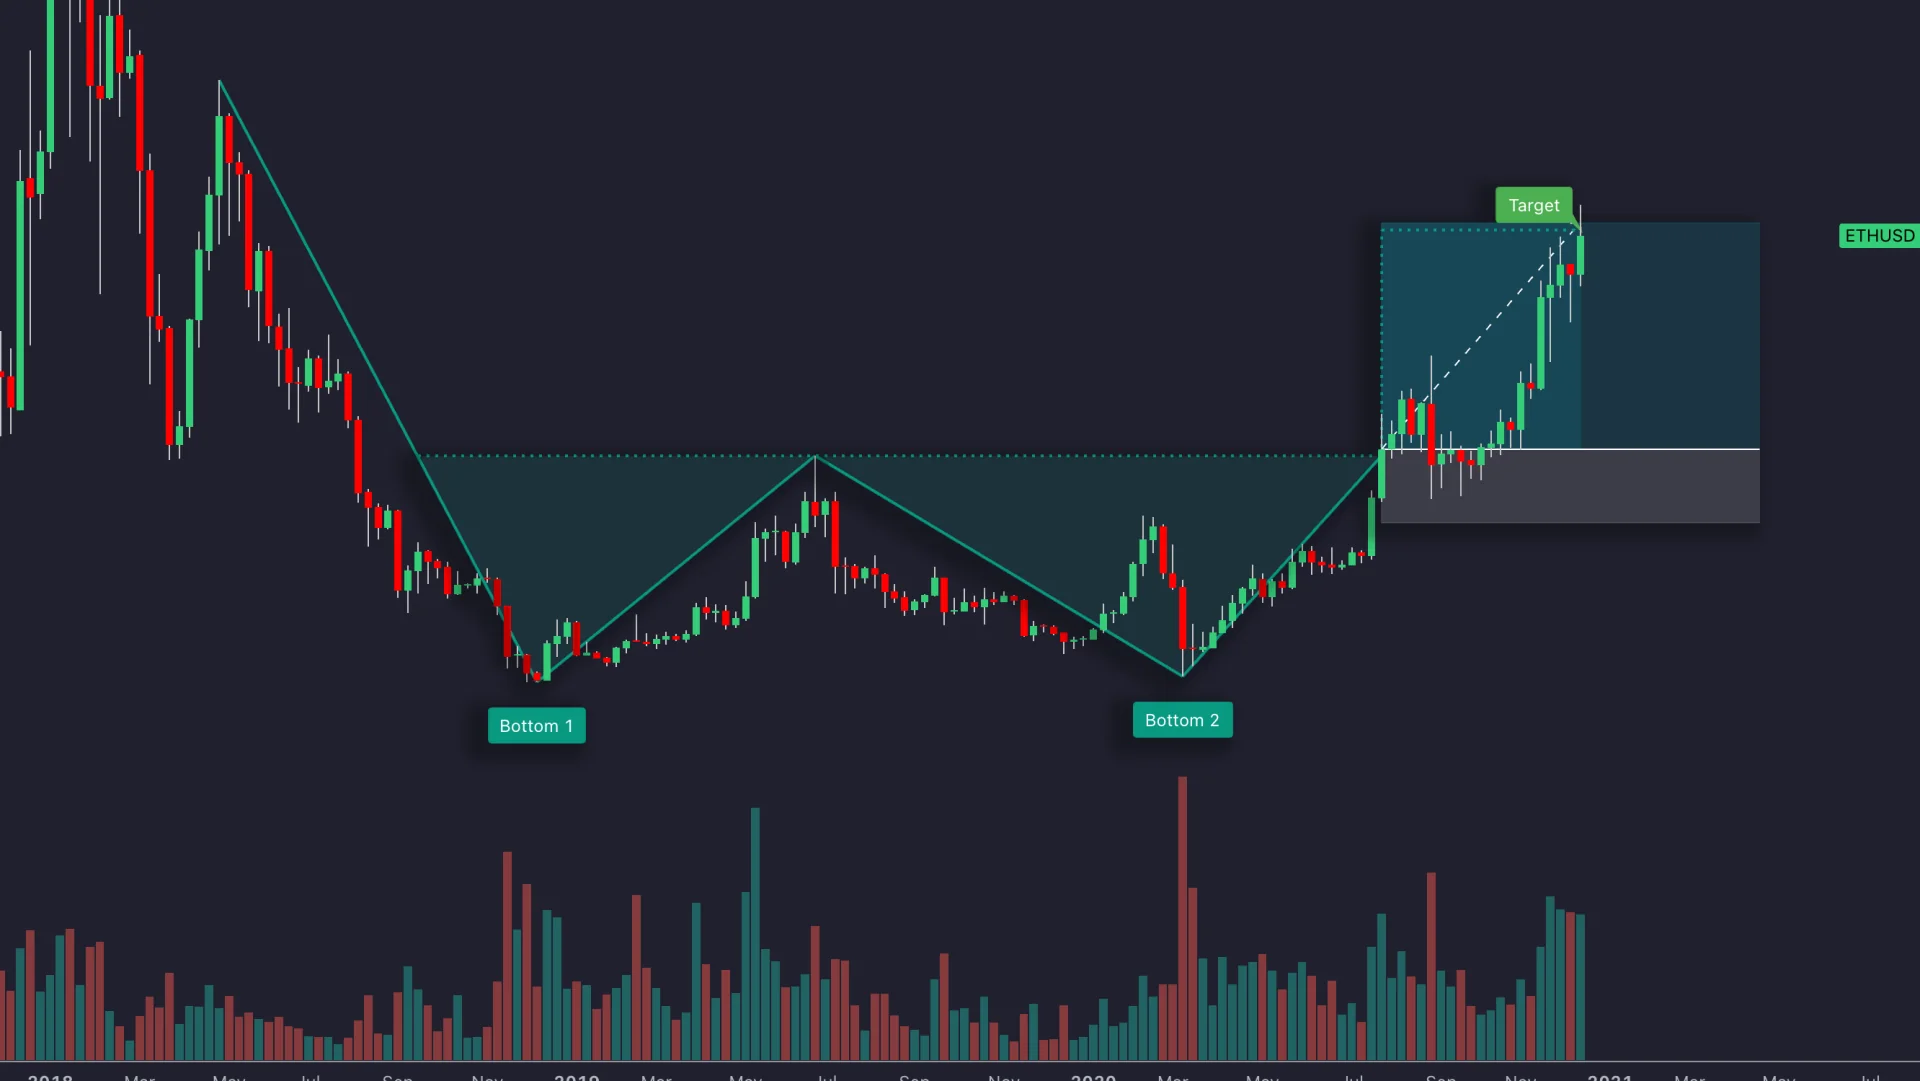
For example, lows at 98.00 and 98.20 fit a chosen 0.30 tolerance, with a neckline at 103.00. A completed close above 103.00 can be the event under one rule. A close at 102.90 has not satisfied that rule even if the chart resembles a W. A strategy that waits for a later retest is a different entry method and can miss moves that never return.
Rounding bottoms and tops
A rounding bottom is a gradual transition from decline through a base into recovery. It need not be perfectly symmetrical, and it often develops over a longer horizon than a short flag. Its bullish interpretation depends on a break of the relevant resistance, rather than merely drawing a curve beneath prices. A rounding top describes the opposite broad transition; neither shape reveals the identity of buyers or sellers.
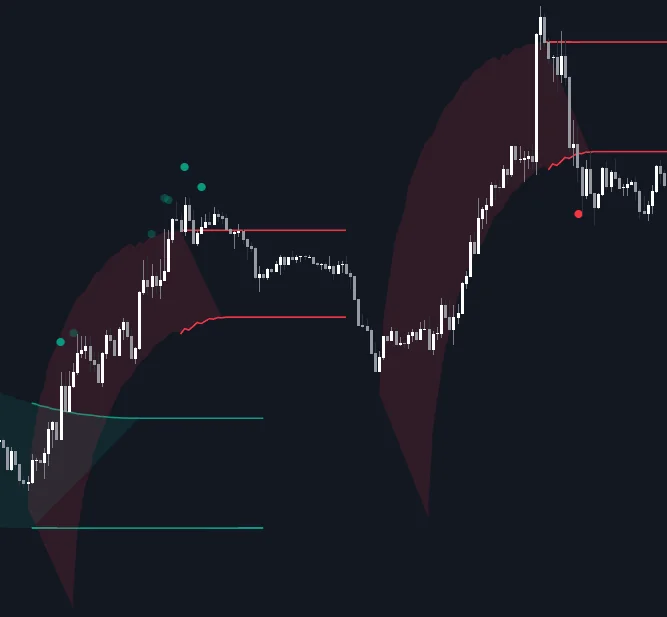
Keep a rounding base distinct from a cup-and-handle pattern, which includes an additional consolidation near the rim. Volume beneath a base can be informative, but an oscillator is not a substitute for traded-volume bars. Do not infer accumulating institutional orders solely from a curved price path.
Continuation candidates: wait for the direction
Ascending, descending and symmetrical triangles
An ascending triangle combines broadly flat upper resistance with rising lows; a descending triangle combines broadly flat lower support with falling highs. A symmetrical triangle has falling highs and rising lows. These shapes describe compression, not a guaranteed breakout direction. Decide which pivots define each boundary and when those pivots became available.
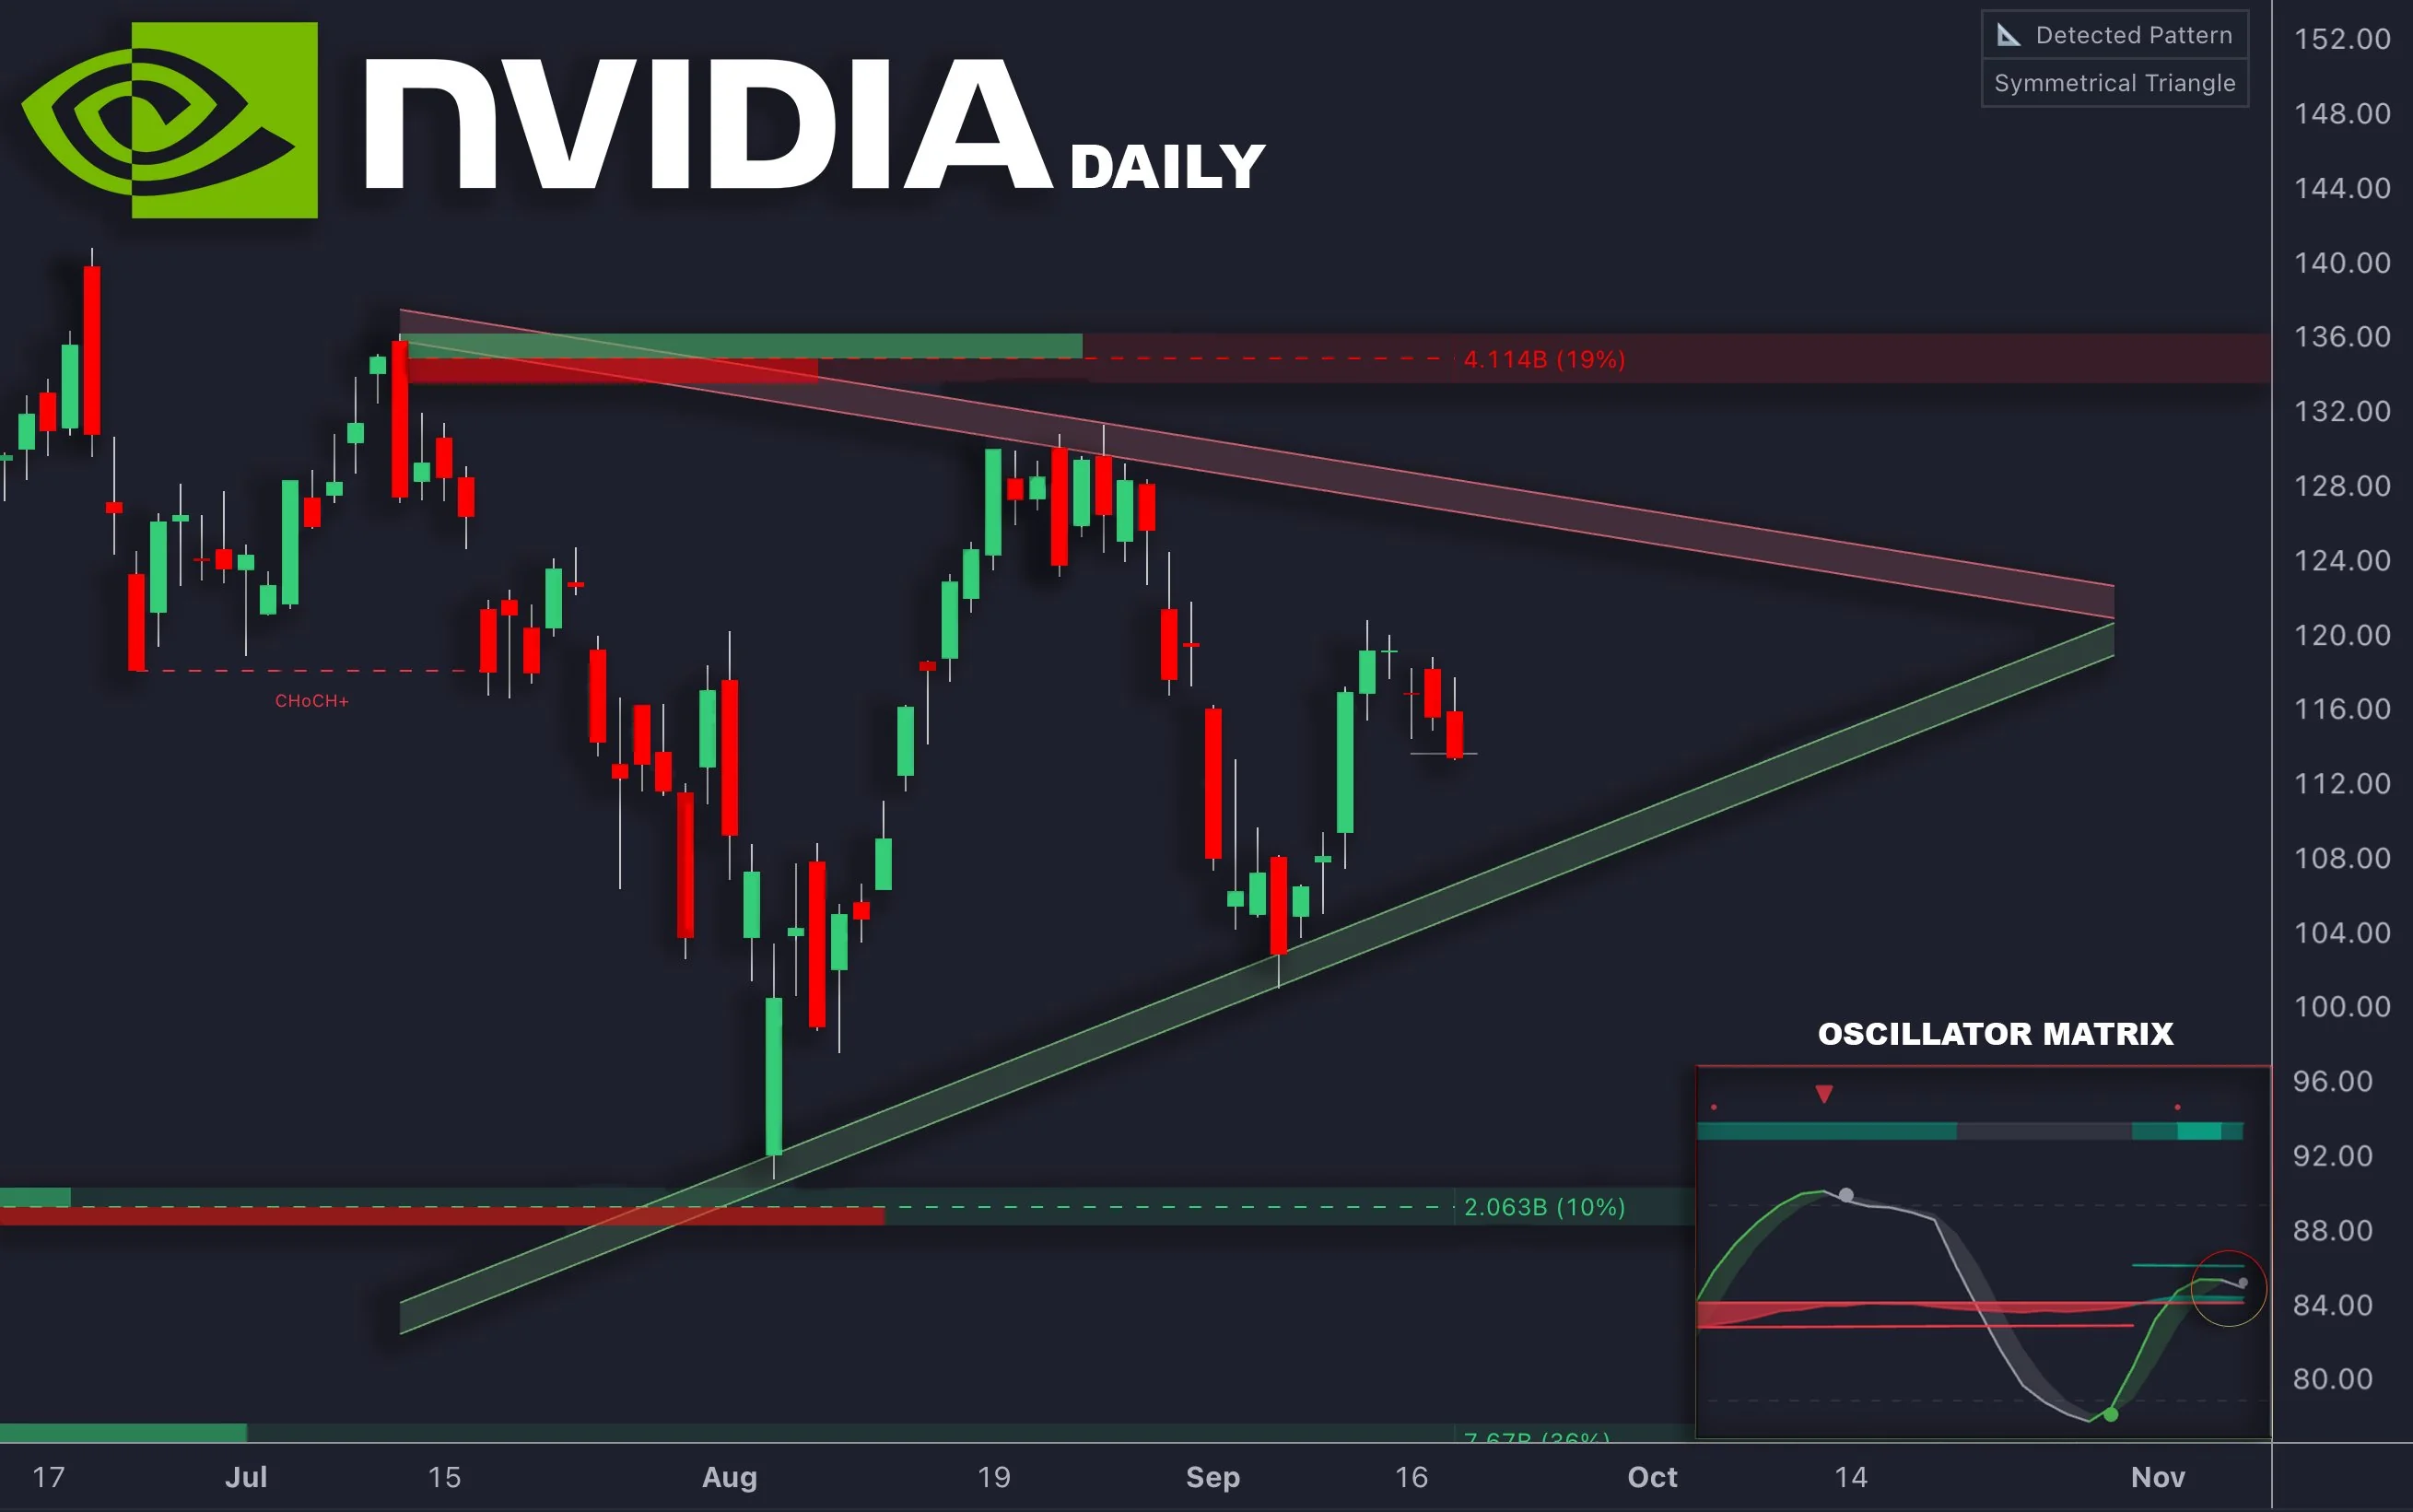
A close beyond a boundary is one possible completion rule. You may require a buffer, such as 0.1 times the prior bar’s ATR, to reduce sensitivity to tiny excursions. That is an example parameter to test, not a universal standard. A failed upward break can return inside the triangle or break downward; record failures alongside successful examples.
Flags, pennants and rectangles
Flags are short, roughly parallel consolidations after a pronounced move; pennants use converging boundaries. Traders commonly study them as continuation candidates, but a break against the preceding move is possible. Define the preceding move’s size, the consolidation’s maximum duration and the exact boundary rule rather than label every small pause a flag.
Rectangles contain repeated reactions between horizontal support and resistance. Buying near the lower boundary and selling near the upper boundary is a range strategy; entering after a boundary break is a breakout strategy. Keep their entries, stops and evaluation separate. A rectangle can resolve in either direction, including against the trend that preceded it.
Short-term candlestick signals
Candlesticks summarize one or a few bars, while larger chart patterns organize multiple swings. A candle’s context matters: the same shape after a decline and after an advance can have different interpretations. The StockCharts candlestick dictionary describes the following structures; none establishes a reliable trade on its own.
| Candle pattern | What to measure | What still needs a rule |
|---|---|---|
| Doji | Open and close are equal or close together relative to the bar range. | Define “close together”; a small body alone does not select a direction. |
| Hammer | Small body near the top of the range with a long lower shadow after a decline. | Specify trend context and any later bullish confirmation; the shape alone is not a completed reversal. |
| Bullish engulfing | After a decline, an up candle’s real body encompasses the previous down candle’s real body. | Specify equality at the edges, entry timing and invalidation. The wicks need not be engulfed. |
| Bearish engulfing | After an advance, a down candle’s real body encompasses the previous up candle’s real body. | Define bearish confirmation and exits before testing. |
For an explicit doji detector, you could require absolute close minus open to be at most 5% of high minus low, while handling zero-range bars separately. That 5% cutoff is a chosen implementation, not the universal definition of a doji. A hammer detector might specify a lower shadow at least twice the body, then test a later close above the hammer high as a separate condition.
LuxAlgo’s Candlestick Structure indicator provides another way to study candle classifications. Its bullish/bearish structure readings are not a win probability. An engulfing candle can still fail, particularly if an entry is late or the stop distance overwhelms the potential reward.
A repeatable pattern-trading workflow
- Fix the context: choose the instrument, venue, timeframe and trend definition. Do not switch timeframes only after a failed candidate.
- Define the geometry: record pivot rules, price tolerance, minimum separation and expiry. A pivot requiring three later bars is only known after those bars have occurred.
- Separate state from event: “price is above resistance” can remain true for many bars; “the first qualifying close crosses resistance” is one event. Specify whether a second entry is allowed.
- Choose one entry method: completed-bar breakout, next-bar entry or a later retest with an expiry. Do not silently require future continuation to classify an earlier trade as valid.
- Set risk and exits: define the structural stop, order sizing, target, time exit and any trailing rule before observing the outcome.
Use volume, RSI and VWAP as explicit filters
Bar volume measures activity during a bar; volume profile distributes traded volume across price levels. They answer different questions. An example breakout filter is volume greater than 1.5 times the mean of the preceding 20 completed bars, excluding the breakout bar from that baseline. Verify the venue and type of volume: one exchange’s activity is not automatically the entire market.
RSI can describe momentum, while VWAP provides a volume-weighted average price over a specified session or anchor. A VWAP crossing is not automatically an entry, exit or reversal of a chart-pattern trade. If you require a long breakout to close above session VWAP and RSI to exceed 50, record those as additional filters and compare with the unfiltered setup. Several indicators derived from the same prices are not independent proof.
Calculate position size from risk
Risk budget and position value are different. In a hypothetical $20,000 account, a chosen 1% budget is $200. Reserve $20 for estimated costs, leaving $180 of price risk. With entry at $104 and stop at $101, the $3 distance permits 60 shares: $180 ÷ $3. The position value is $6,240, not $200. These are example assumptions, not a universal sizing recommendation.
A target at $110 would yield $360 gross, or 2R relative to the $180 initial price risk. A fill at $98 after a gap would lose $360 before costs, exceeding the planned stop loss. If the stop is widened to $98 before entry, the same price-risk budget permits only 30 shares. Use the correct contract multiplier for other instruments and include correlated positions in the portfolio risk review.
Trailing stops need an explicit update schedule and a rule against loosening risk unintentionally. For a long trade, an example is the greater of the prior stop and a newly calculated trailing level. Partial exits alter realized reward: selling half the 60 shares at $107 and half at $110 produces $270 gross, or 1.5R, rather than the full-target 2R.
Research patterns in native LuxAlgo
Ask Quant to build a supported native strategy from your precise pattern rules, including pivot delays, boundary calculations, completed-bar entry, stop, target and expiry. Inspect the generated code, then run it manually. Check individual detections and fills against the chart before interpreting the backtest summary.
- Review strategy Inputs and Properties, including order size, capital, commission and slippage. Establish how the test handles a bar containing both stop and target.
- Compare the simplest pattern rule with each extra filter on identical dates and costs. Hold out unseen periods and examine different market conditions.
- Prevent future information from entering earlier signals. A historical marker can be drawn at a pivot even though detection required subsequent bars.
- Track failed patterns, trade count, drawdown and average outcome after costs. A high win rate alone does not establish a useful strategy.
Visual pattern detection on a Quant Chart
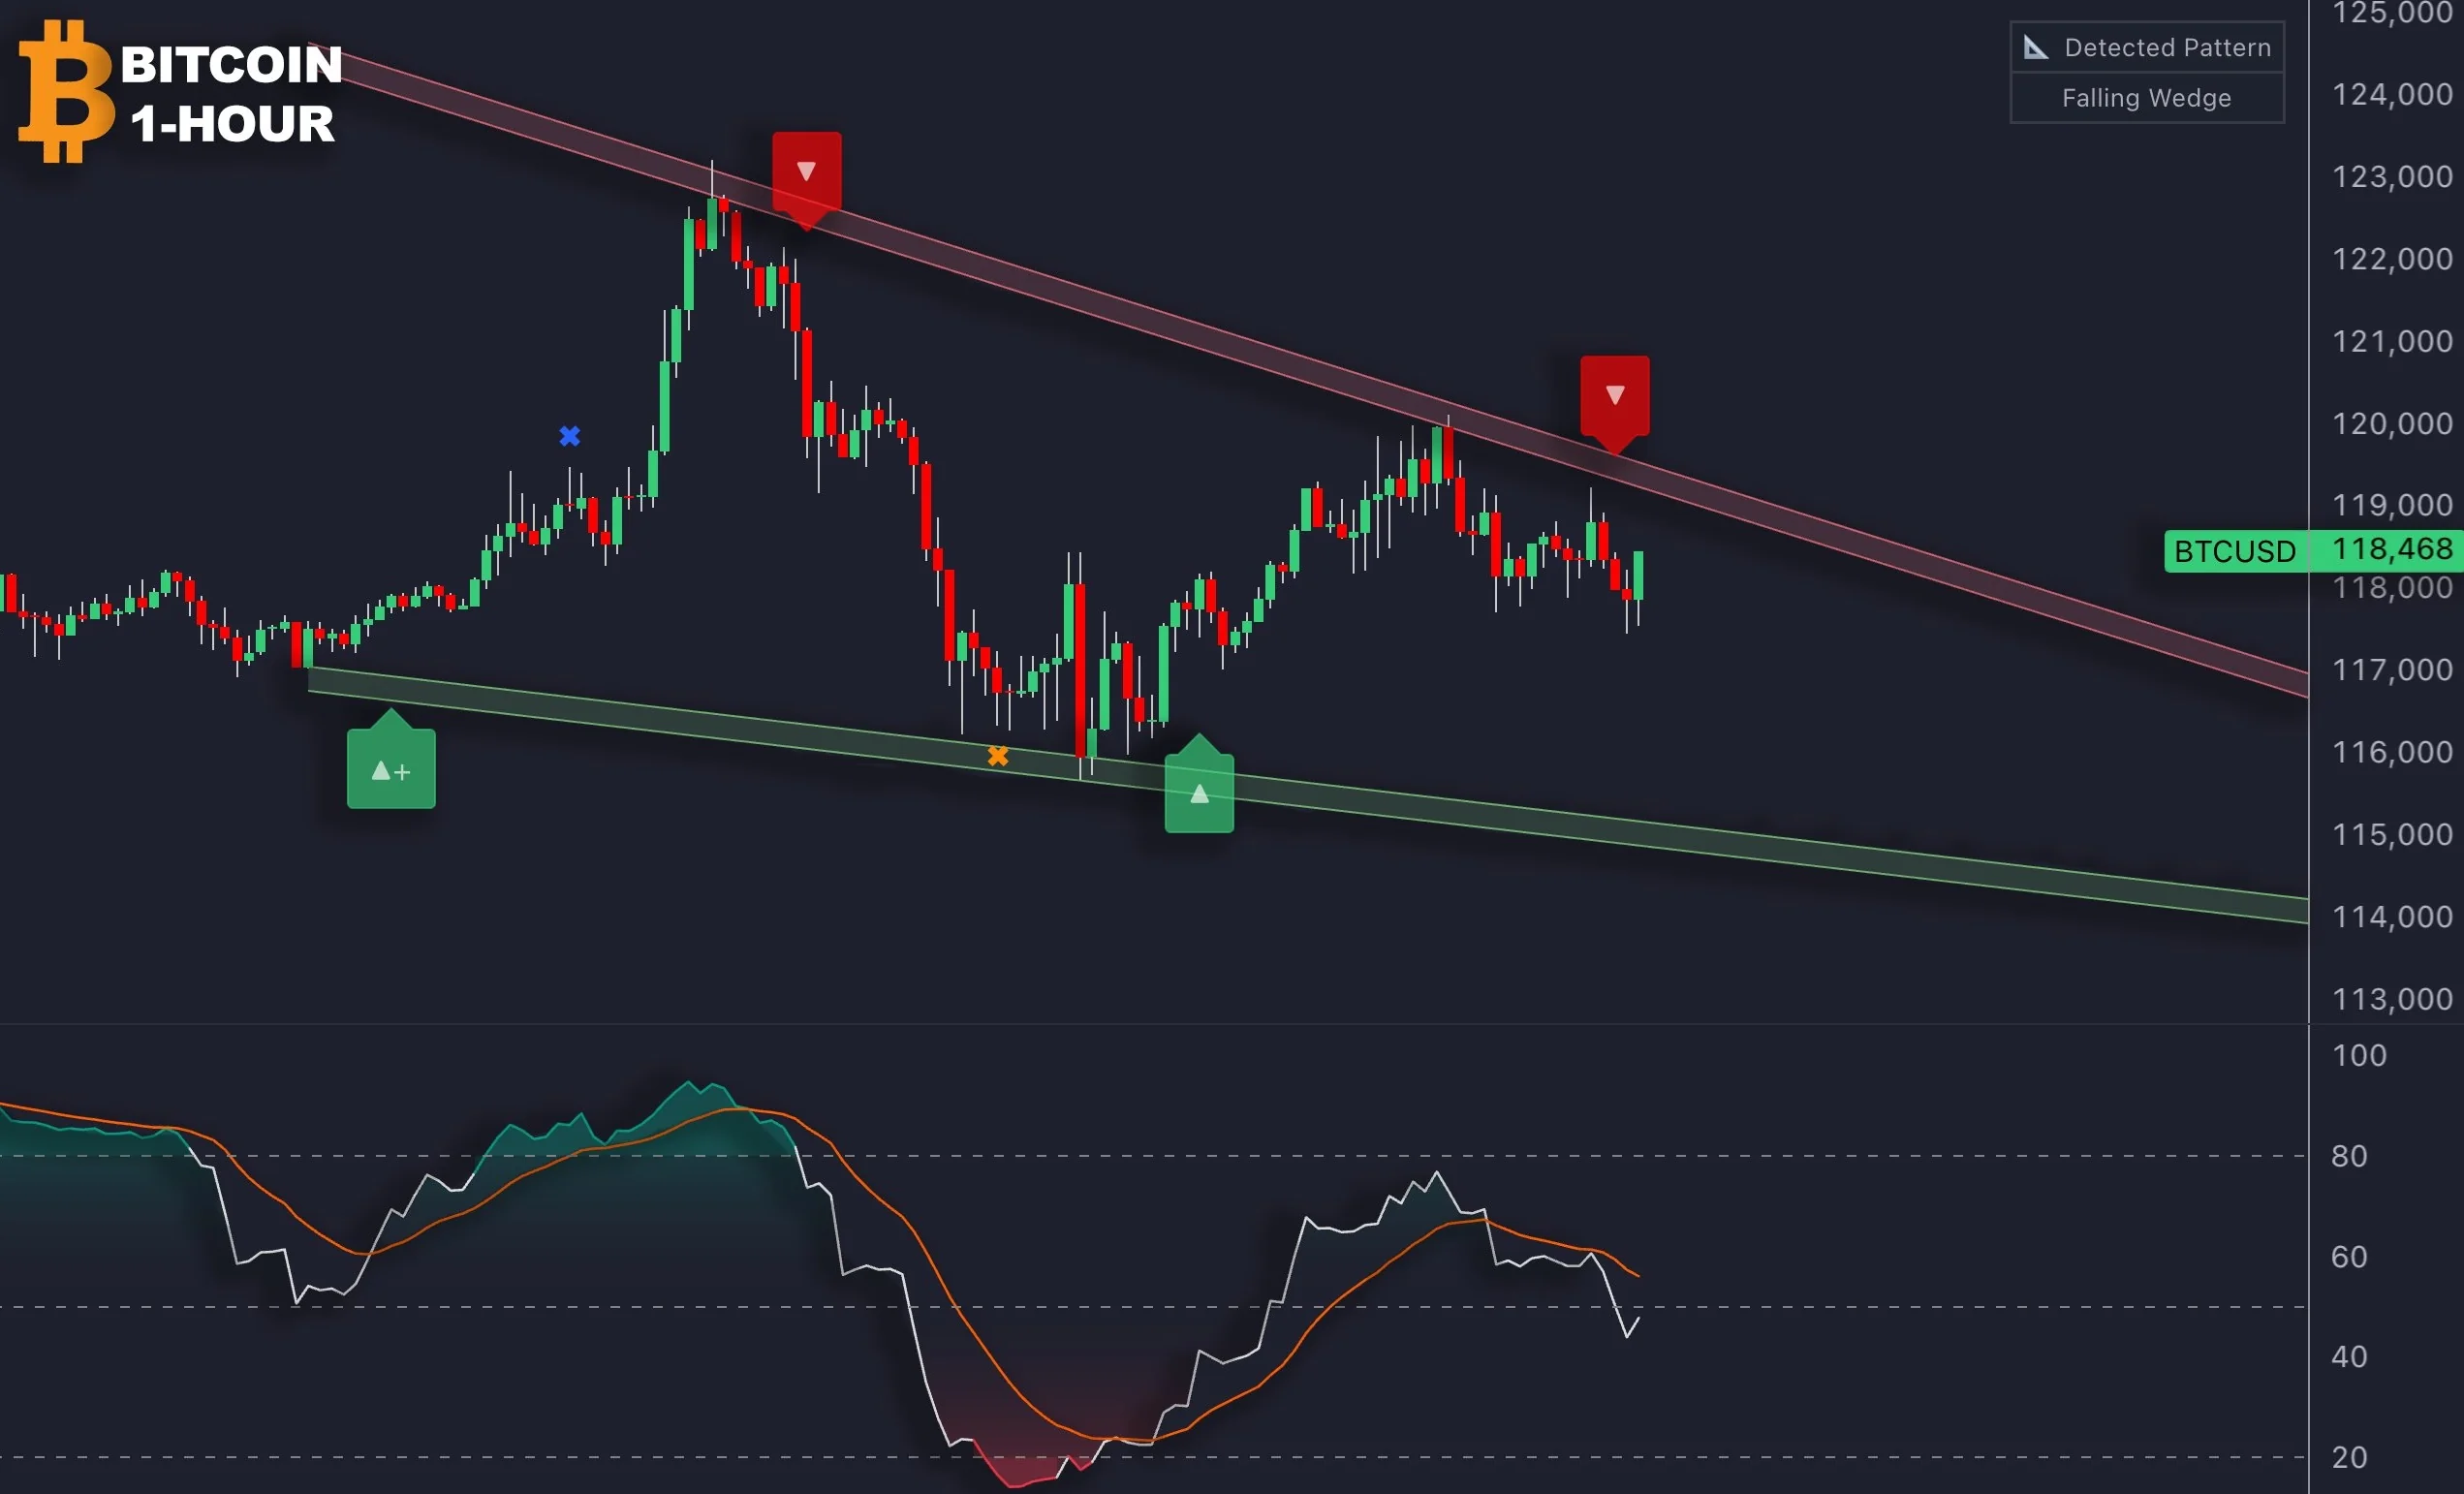
The Library’s pattern and market-structure tools add automated price-action annotations on a Quant Chart. Swing-based elements such as equal highs/lows and liquidity trendlines are confirmed retrospectively. Record the actual settings and detection time when turning labels into a test.
Frequently asked questions
Which chart pattern is the most reliable?
There is no universal winner across instruments, timeframes and entry rules. Compare fully specified setups after costs, include failures and evaluate unseen periods before drawing a conclusion.
Does a chart pattern require a retest?
No. A breakout entry and a later retest entry are different methods. A retest can offer another decision point, but some moves never return to the boundary.
Do triangles always continue the previous trend?
No. Ascending, descending and symmetrical triangles describe their boundaries. They can break in either direction, and an initial break can fail.
What is the difference between a doji and a hammer?
A doji has an open and close close together. A hammer has a small body near the upper end of its range and a long lower shadow after a decline. Neither shape guarantees a reversal.
Is risking 1% the same as investing 1% of the account?
No. Planned risk depends on position size, entry-to-stop distance, costs and the instrument multiplier. Position value is a separate amount, and gaps can cause losses beyond the planned risk.
How should I use Quant for pattern research?
Specify causal pattern detection, entry timing, position sizing and exits. Inspect the generated code and run it manually. Review chart examples, costs and unseen periods rather than assuming a generated script is profitable.
References
- StockCharts ChartSchool — Head and Shoulders Top; neckline construction, completion, volume and measured-move limitations.
- StockCharts ChartSchool — Rounding Bottom; base structure and resistance break.
- StockCharts ChartSchool — Double Bottom Reversal and Double Top Reversal; two-test structures and breakout references.
- StockCharts ChartSchool — Symmetrical Triangle and Flag, Pennant; compression, breakout direction and continuation conventions.
- StockCharts ChartSchool — Candlestick Pattern Dictionary; doji, hammer and engulfing definitions.
- LuxAlgo — Candlestick Structure; indicator classifications and structure readings.
- LuxAlgo — Native charts and chart data; native chart workflow and data scope.
- LuxAlgo — Quant strategies and native strategy settings; code review, manual execution and testing assumptions.
- LuxAlgo — PAC pattern-detection overview video; recorded visual demonstration of the TradingView toolkit.
Read next