Signals & Overlays
 By LuxAlgoApr 11, 2020
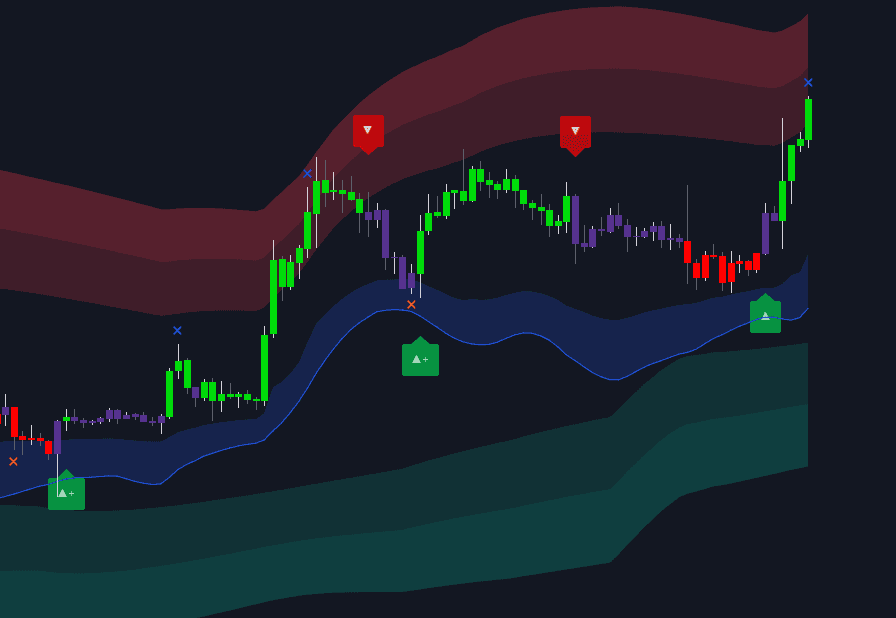
Signals & Overlays™ is the most popular LuxAlgo toolkit — a single indicator that combines two signal engines, five indicator overlays, optimization methods, and a metrics dashboard so a trader can assemble a complete charting workflow from one settings menu. It serves beginners running one-click Presets as well as systematic traders who filter, classify, and alert on every signal. Its companion tools extend it beyond a single chart: the Screener (S&O) tracks its features across up to 10 tickers, and the Backtester (S&O) turns its signals into testable strategies.
What's Inside the Signals & Overlays™ Toolkit?
- Confirmation + Exits: a performance-adaptive trend-following mode producing normal and strong (+) signals, where + labels agree with the estimated trend and normal labels can come from retracements. Exit crosses (blue bullish, orange bearish) suggest areas to consider closing a position.
- Contrarian + Exits: signals that deliberately oppose the current trend to spot potential tops and bottoms, with strong (+) labels reserved for excessively overbought or oversold conditions.
- ML Classifier: an adaptive threshold classifier that grades every Confirmation or Contrarian signal from 1 to 4 directly on its label — lower numbers lean retracement, higher numbers lean continuation — with an input to keep only the grades you want on the chart.
- Indicator Overlays: the Smart Trail trailing stop with support/resistance areas, Reversal Zones for tops and bottoms, the Trend Tracer and faster Trend Catcher trend estimates, and the Neo Cloud, each with a 1–5 period setting.
- TP/SL Points: four take-profit/stop-loss levels calculated from a user-selected condition — Signals, Smart Trail, Reversal Zones, Trend Catcher, Trend Tracer, Neo Cloud, or the Custom Alert Creator — with a Distance control.
- Candle Coloring: Confirmation Simple (green/red/purple), Confirmation Gradient, and Contrarian Gradient modes that also work on Heikin-Ashi, Renko, Kagi, line break, point and figure, and range charts.
- Dashboard: Optimal Sensitivity from grid-search optimization, Trend Strength, Lux Volatility, Squeeze, and Volume Sentiment in a repositionable panel.
- Presets / Filters: Trend Trader, Scalper, Swing Trader, and Contrarian Trader presets enable curated feature sets in one click, while Smart Trail, Trend Tracer, Trend Catcher, Neo Cloud, and Trend Strength filters suppress signals that disagree with the chosen overlay or metric.
- Alerts: pre-set conditions for every signal type, any alert() function call conditions with message placeholders, a step-based Custom Alert Creator, and Alert Scripting for fully scripted conditions.
How to Trade with Signals & Overlays™?
- Read the trend before the signal: candle coloring holding green after a bullish Confirmation signal supports continuation; fading toward purple warns of ranging conditions where Contrarian mode is more at home.
- Demand confluence: enable one or two overlays and act only when they agree — for example, Confirmation signals taken above the Smart Trail, with Reversal Zones marking profit-taking areas.
- Let filters formalize the rule: the Smart Trail or Trend Strength filter removes non-aligned signals automatically; the trade-off is missed entries when the filter lags a fresh trend.
- Check the dashboard first: Trend Strength above 50% marks a trending market where Confirmation signals excel, while high Squeeze readings flag compression to be patient through.
- Plan exits up front: exit crosses support partial profit-taking during longer trends, and TP/SL Points project four graded targets from your chosen trigger, since a trailing stop approach via the Smart Trail suits trend riders better than fixed targets.
Key Settings & Modes
- Signal Mode (default Confirmation + Exits): switches between Confirmation, Contrarian, or None.
- Signals Sensitivity (default 12): lower values (5–10) catch shorter-term moves, higher values (20+) longer-term trends.
- Autopilot Sensitivity (Off / Short-Term / Medium-Term / Long-Term): lets the algorithm adjust sensitivity dynamically so you never tune it manually.
- Presets / Filters (default None): one-click presets or signal filters; presets lock affected settings while active.
- Candle Coloring (default Confirmation Simple) and ML Signal Classifier (default off, filter input 1234).
- TP/SL Levels (default None) with Distance (default 5).
- Dashboard Location (default Bottom Right) and Dashboard Size (default Tiny), plus toggles for each dashboard metric.
Frequently Asked Questions
How do I get access to Signals & Overlays™?
Signals & Overlays™ is a premium toolkit, not part of the free library flow — it does not load into Quant from this page. Access comes with a LuxAlgo subscription plan; once subscribed, you add the toolkit to your charts across supported platforms and every feature above is included, along with the S&O screener.
What is the difference between Confirmation and Contrarian signals?
Confirmation signals follow a performance-adaptive trend methodology and are meant to confirm a developing move, while Contrarian signals oppose the trend to time potential tops and bottoms with less lag but more exposure to large adverse moves. Both produce normal and strong (+) grades and both include exit signals.
How does it compare to the other LuxAlgo toolkits?
Signals & Overlays™ generates signals and overlay indicators on the price chart, Price Action Concepts™ automates raw price action such as market structure and order blocks with no signal engine, and Oscillator Matrix™ works in a separate oscillator pane. Many traders run one chart-based toolkit alongside the oscillator for confluence.
Can I automate alerts from the toolkit?
Yes — beyond per-signal alert conditions, any alert() function call conditions combine multiple events into one alert with placeholders (ticker, timeframe, OHLCV, overlay values) that can be formatted as JSON. The Custom Alert Creator chains conditions into steps with invalidation rules, and Alert Scripting covers fully custom logic.
What is the Optimal Sensitivity shown on the dashboard?
It is a grid-search estimate of the best Sensitivity setting, backtesting values from 10 to 20 over the most recent 250 bars for the selected signal mode. It requires at least 250 bars of history, and like any optimized setting it is not indicative of future results — Autopilot is the hands-off alternative.
The Library is free. Quant makes it yours.
Pull any concept or indicator into Quant: rebuild it, retune it, or turn it into a backtested strategy of your own.